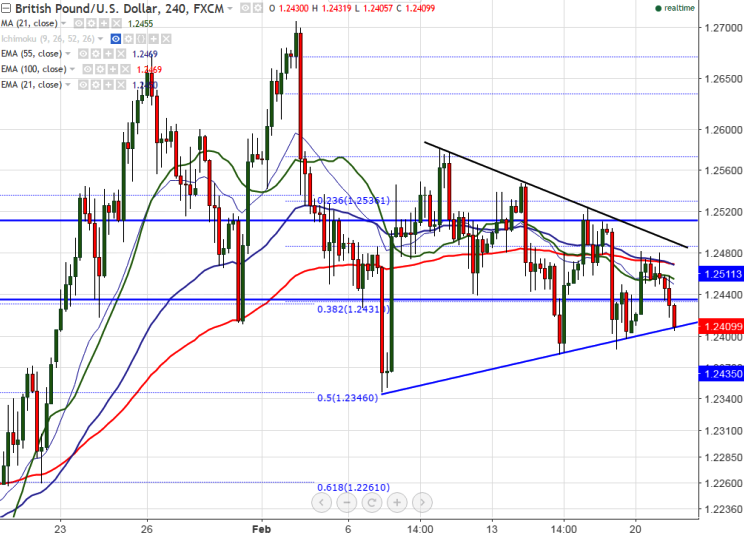
GBP/USD forms contracting triangle pattern, break below 1.2400 targets 1.2260
Major intraday support - 1.23800 (Feb 15th 2017 low) Major Resistance – 1.2505 (trend line joining 1.25820 and 1.25482). Cable has once again declined after making a high of 1.2480.It is currently trading around 1.24020.…
Major intraday support - 1.23800 (Feb 15th 2017 low)
Major Resistance – 1.2505 (trend line joining 1.25820 and 1.25482).
Cable has once again declined after making a high of 1.2480.It is currently trading around 1.24020.
On the lower any violation below 1.23800 will drag the pair down till 1.234500 (50% retracement of 1.19860 and 1.27060). Any break below 1.23450 confirms further weakness, a decline till 1.2260/1.2200 likely.
The minor trend reversal can be happen only above that 1.2580 level and any break above will take the pair till 1.2705 (Feb 2nd 2017 high)/1.27750 (Dec 6th 2016 high).
Overall trend reversal only above 1.2780 level.
It is good to sell below 1.2400 with SL around 1.2455 for the TP of 1.2345/1.2300/1.2260.