


 JPY Action Bias: Extremely Bullish Surge Ignites Across NZD, GBP & AUD
  FxWirePro: GBP/NZD gains some upside momentum but still bearish
  FxWirePro: USD/JPY uptrend loses steam, remains on bullish path
  NZDJPY Bullish Surge: Strong Kiwi Ignites Fresh Upside as 94 Support Holds and All EMAs Align
  Crypto Major Pair Action Bias: ETHUSD Bullish as BTCUSD, SOLUSD & XRPUSD Stay Neutral
  FxWirePro: NZD/USD trades in narrow range ,outlook bullish
  GBPJPY Bullish Surge: Strong Pound Ignites Fresh Upside on Fed-BOE Policy Divergence as All EMAs Align
  FxWirePro- Major Crypto levels and bias summary
  ETH Stands Alone Bullish; BTC, SOL, XRP, BNB Neutral
  FxWirePro: AUD/USD edges lower, but bullish outlook persists
  FxWirePro: GBP/USD under pressure despite UK's modest economic growth
  FxWirePro: EUR/AUD outlook weaker on renewed downside pressure
  FxWirePro- Woodies pivot (Major)
  FxWirePro- Major Pair levels and bias summary


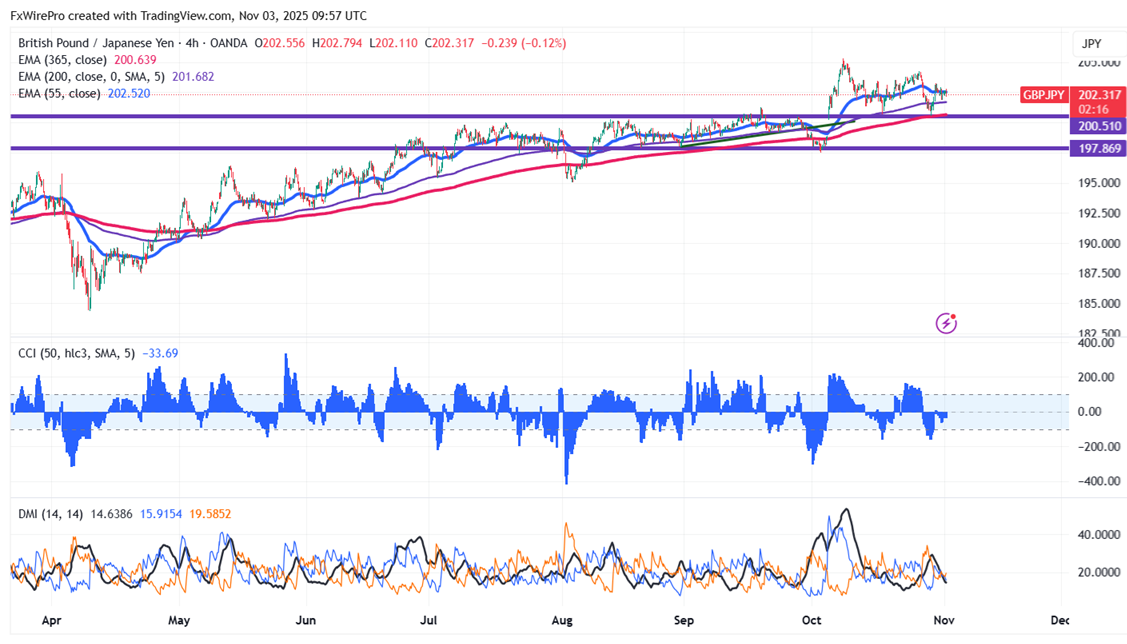
GBPJPY was slightly profit booked as the pound sterling singlehandedly dropped over 200 pips last week.. The bullish momentum on the daily chart still prevails. The pair is changing hands at 202.33 levels after hitting an intraday low of 202.11.
Oscillators and moving averages to forecast the trend of GBPJPY
CMP- 202.33
EMA (4-hour chart)
55-EMA- 202.52
200-EMA- 201.67
365-EMA- 200.63. The pair trades below short and above long term moving average.
Major Support- 202. Any breach below will drag the pair down 201.30/200.50/200/199.30/198.34/197.40.
Major resistance - 202.80. Any break above confirms minor bullishness, a jump 203.30/204/204.25/205 is possible.
Indicator (4 hour chart)
CCI (50)- Bearish
Average directional movement Index- Neutral. All indicators confirm a mixed trend.
It is good to buy on dips around 202.18-20 with SL around 201.30 for a TP of 205.


