Technicals

Add as a preferred source on Google

GBPJPY Stuck in Tight Range: Bullish Bias Holds Above 211.50 – Dip Buyers Targeting 215 Breakout?

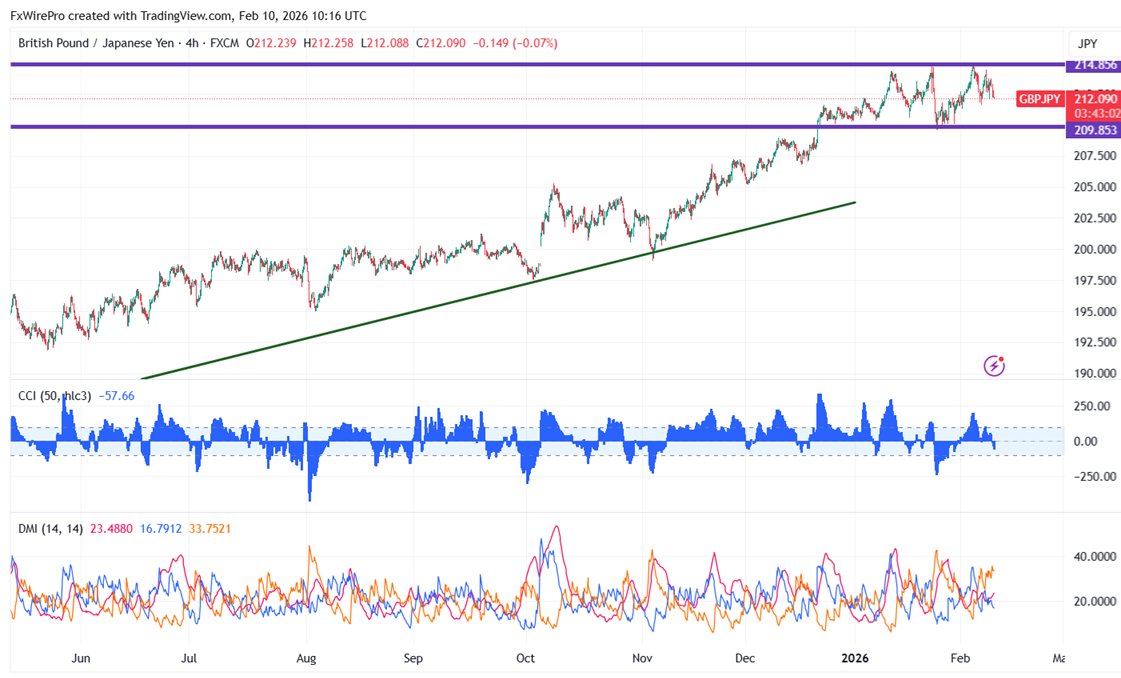
GBPJPY has traded in a narrow range between 211.61 and 214.40 for the past two days. The intraday trend is bullish as long as support 211.50 holds. As of publishing, it is trading around 212.60; its intraday low is 212.1…

1 min read
GBPJPY Stuck in Tight Range: Bullish Bias Holds Above 211.50 – Dip Buyers Targeting 215 Breakout?
Image from the original EconoTimes article

Read the original article

GBPJPY has traded in a narrow range between 211.61 and 214.40 for the past two days. The intraday trend is bullish as long as support 211.50 holds. As of publishing, it is trading around 212.60; its intraday low is 212.17.

Oscillators and moving averages to forecast the trend of GBPJPY


CMP- 212.59


EMA ( 4-hour chart)


55-EMA- 212.82


200-EMA- 211.51


365-EMA- 209.65. The pair trades below the short (55- EMA) and above long-term moving average (200 and 365 EMA).

 Major Support- 212.85. Any breach below will drag the pair down to 212.30/211.75/211/209.70/208.50/208 .


Major resistance - 212.80.  Any break above 212.80 confirms minor bullishness; a jump to 214.20/215 is possible.

Indicator (60-min chart)

 CCI (50)-  Bearish

Average directional movement Index-  Neutral. All indicators confirm a mixed trend.


It is good to buy on dips around 212.48-50  with SL around 211.29 for a TP of 215.



Related articles

View all
Technicals

Major Pair Currency Score: AUDUSD Bearish

EURUSD - Levels to watch - 1.100 GBPUSD Levels to watch - 1.3180 USDCHF Levels to watch - 0.8400 USDCAD - Levels to watch - 1.4300 AUDUSD - Levels to watch - 0.7000 NZDUSD - Levels to watch - 0.5560

