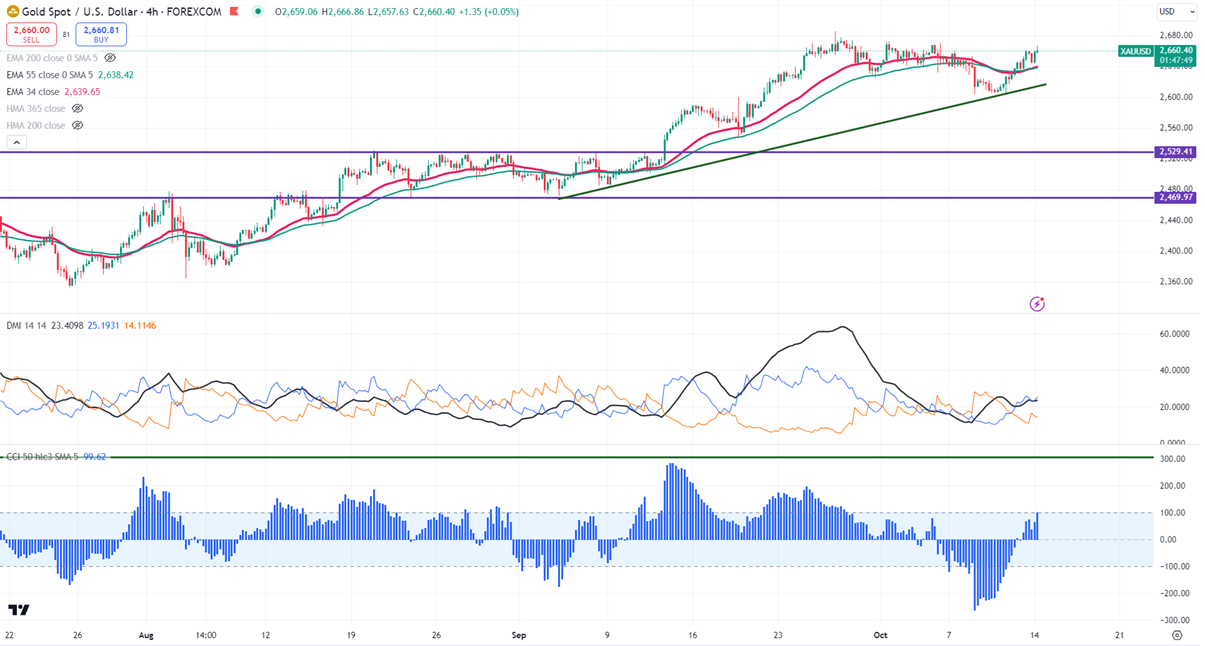
Gold jumped sharply after hitting a minor bottom around $2602 as demand for safe-haven increased. It hit a high of $2666 at the time of writing and is currently trading around $2661.74.
The precious metal in the near future is poised for volatility as uncertainty surrounds potential Federal Reserve rate cuts amidst mixed economic signals. Recent job data has led to diminished expectations for future rate reductions, with Treasury yields climbing above 4%. The yellow metal recovered more than $60 as geopolitical tension intensified between Israel and Hamas. Investor skepticism remains regarding the strength of the labor market, indicated by negative reactions to jobless claims.
US dollar index-
The US dollar index breaks significant resistance 103 after a long consolidation. Any close above 103 confirms a bullish continuation.
According to the CME Fed watch tool, the probability of a 25 bpbs rate cut in Nov increased to 88.60% from 84.40% a week ago.
Technical (4 hour chart)-
The yellow metal trades below short-term (34 and 55 EMA ) and below long-term (200- and 365 Hull MA) in the 4-hour chart.
The near–term support is around $2638, a break below targets $2624/$2600/$2570/$2560/$2545/$2520/$2470. Major bearish continuation only below $2470.The yellow metal faces minor resistance around $2670 and a breach above will take it to the next level of $2689/$2700.
Indicator (4- hour chart)
CCI (50)- Bullish
Average directional movement Index - Bullish
It is good to buy on dips around $2628-30 with SL around $2600 for TP of $2700.