
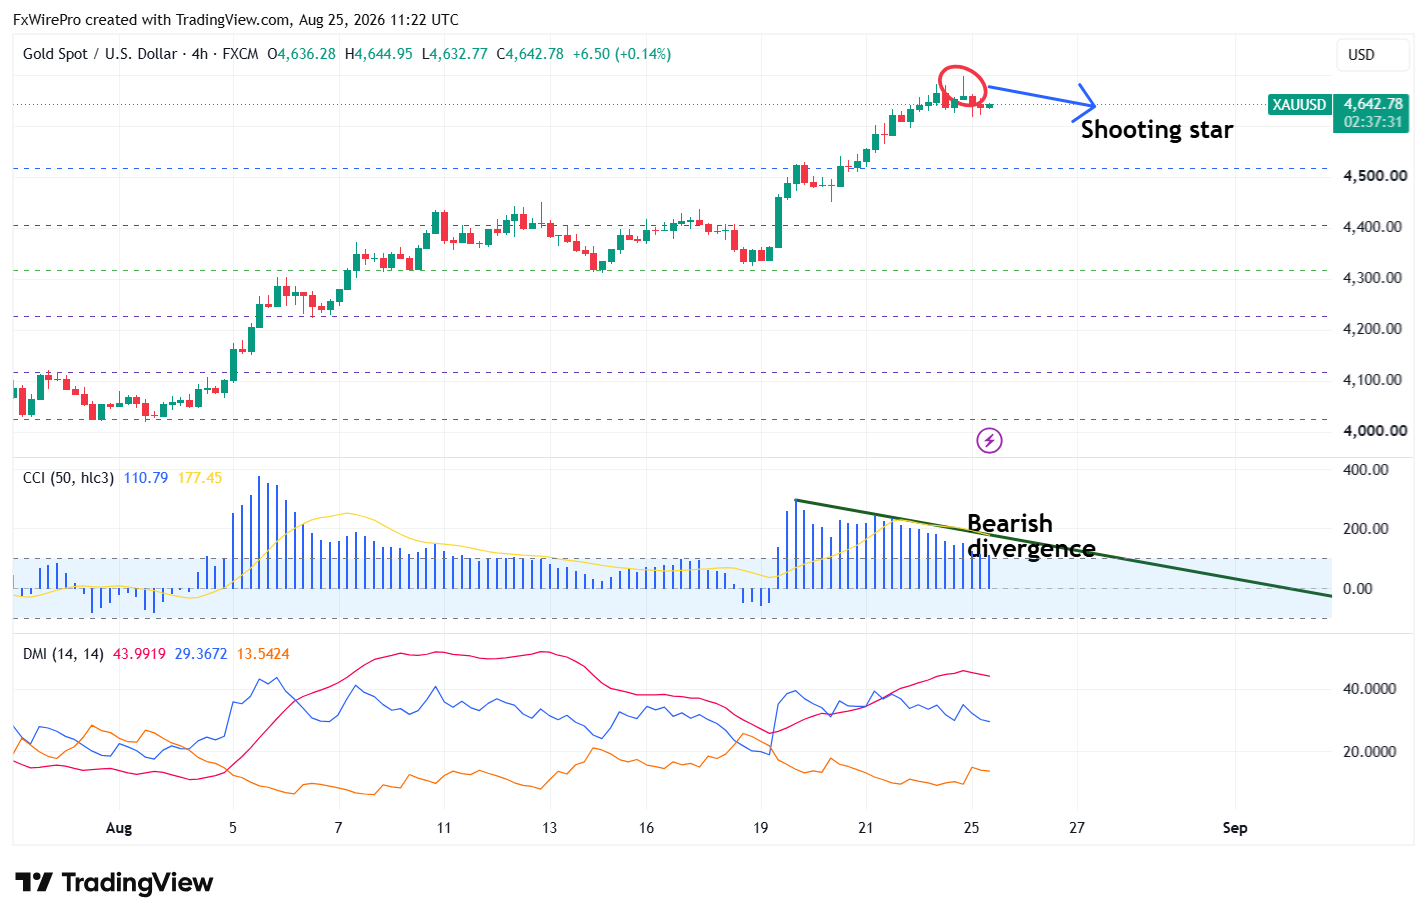
Candlestick pattern- Shooting star (4-hour chart)
Bearish Divergence CCI (50)-(4-hour) Chart.
Gold pared some of its gains due to profit booking. Having reached a high of $4696, it is now at $4639.
|
Technicals |
CMP -$4642 |
Trend |
|
|
4-hour chart |
Value |
|
|
|
55 EMA |
$4482 |
CMP >55 EMA |
Bullish |
|
200- EMA |
$4301 |
CMP >200- EMA |
Bullish |
|
365- EMA |
$4300 |
CMP >365 EMA |
Bullish |
Near -term support -$4600/$4500/$4480$4405/$4300. Major bearishness below $4300. Any violation below $4300 targets $4235/$4215/$4200/$4156/$4080/$4000. Near-term resistance: $4700/$4773/$4800/$4900/$5000.
|
Momentum indicator (4-hour chart) |
Inference |
Value |
|
CCI(50) |
Bullish |
114.08 |
|
ADX |
Neutral |
|
It is good to sell on rallies around $4658-60 with SL around $4700 for a TP of $4300.


