Whether you have a slow-movingbusiness or a rabbit-speed paced, your engagement with your customers has to be continuous. This is because the times are changing and so is the behaviour and demands of your precious business fans.
Those who are in the business industry from more than 20 years now have seen a lot of changes in the ways of approaching and targeting business’s prospective customers. And they are fascinated with the amount of popularity of online sale and purchase. E-commerce has emerged as the biggest giant in the world of business, especially in the `last 10 years.
The competition is tough. Every business now knows how to make their online presence felt to a pool of prospects around the world. The race has begun to optimize the business websites to enhance the customer experience in order to stand out exceptionally among millions of online business. A powerful tool to support this cause is the use of click analytics.
What is click analytics?
When you have a business website up on the internet and all promotions have been made to drive the online searchers towards it, you need to analyze what exactly is happening when searcher lands on your website. Did he stay there for long? Did he click on the item of his interest? Did he shut the webpage too early? How many pages did he browse? If a business owner and strategists could know the answers to these and similar questions, they can achieve a different level of customer satisfaction and business growth. Click analytics is the answer here.
Click analytics is a special type of web analytics which focuses on the stats about where the customer has clicked on the website. This simple analysis leads to more complex data & information for understanding the behaviour of your website’s visitors. An editor of a website uses click analytics to determine the performance of the site.
The results of click analytics and their significance
In technical terminology, the website manager is reading the real-time or unreal-time traffic on the particular business site. The click analytics generally produces the following data results
1. Clicks collection
The major use of the numbers shown by click analytics is to know whether the search by a person, that has led him/her to our website, compelled him/her to click-through one or more of our products/services.
For business strategists, this data is compiled together with respect to the different products and services being offered to see if the quality of theirproduct is able to retain the searcher & convert it into sales.
2. Click-through-rate (CTR)
This is a tool used to rate the search performance. The click analytics compiles the click rates for all the search results. Something like this
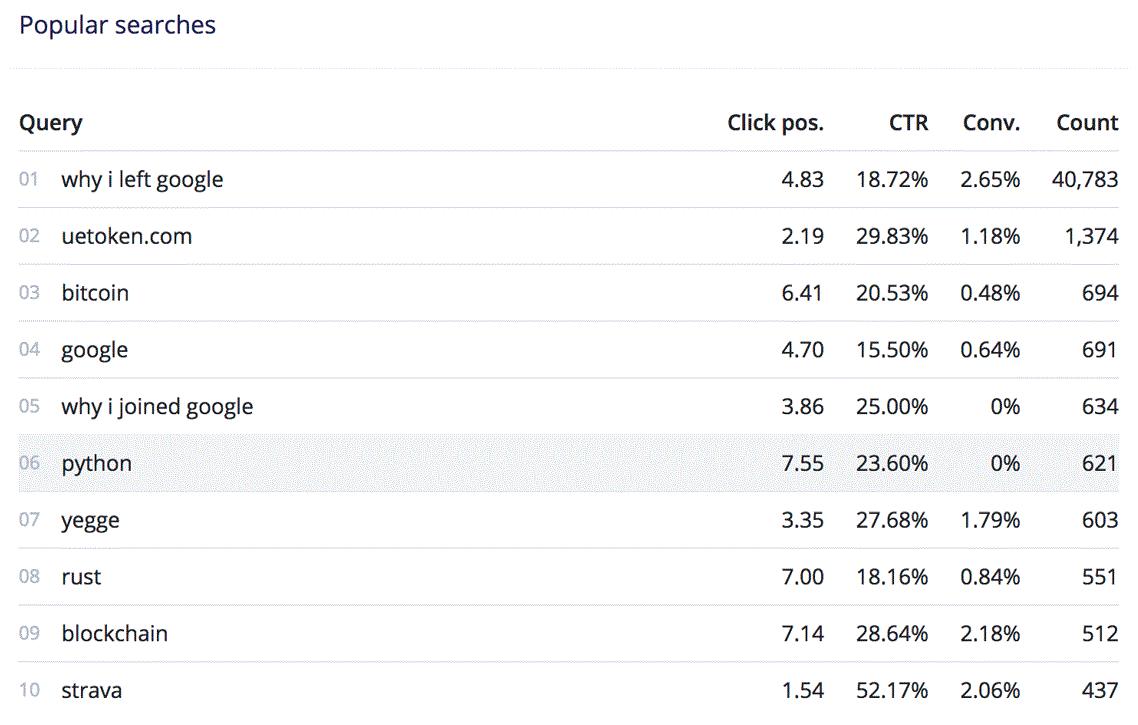
How to analyze the CTR column? If CTR is giving a value of 29.83% for a search, this means 29 percent of your website visitors have clicked on at least one result of that search.
The other information like click position helps in understanding how your SEO efforts are providing you relevant average positions on search engines.
In case of unfavourable stats, the website editors can take actions to rewrite descriptions, reconfigure index settings or update the product/service catalog. At least, you know what is working and what is not.
3. Conversion
The conversion data rate is the data of interest for the company’s sales team (and stakeholders). The analysts check whether the relevant individual queries are leading their prospective customers to take a particular action (like watching the company’s videoor registering themselves on the website or add product in the cart, etc.)
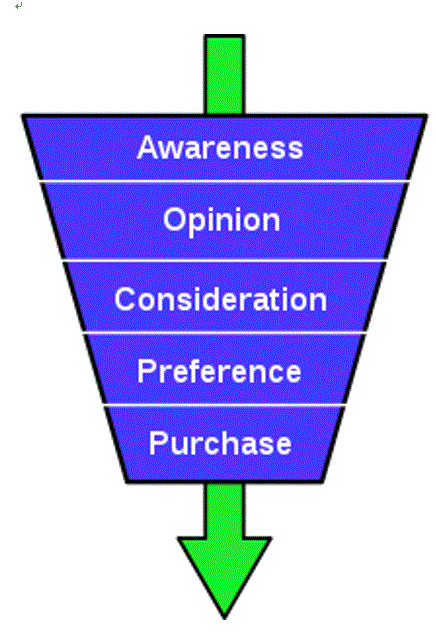
The above image is a purchase behaviour in form of a funnel to know how the click analytics data helps in understanding the searchers’ behaviour and how can things be improved for more conversions, leading to greater sales for your business.
Click analytics is like a third-eye of the business and stakeholders. It brings the business closerto their customers, with better retention and satisfaction value.
This article does not necessarily reflect the opinions of the editors or management of EconoTimes.