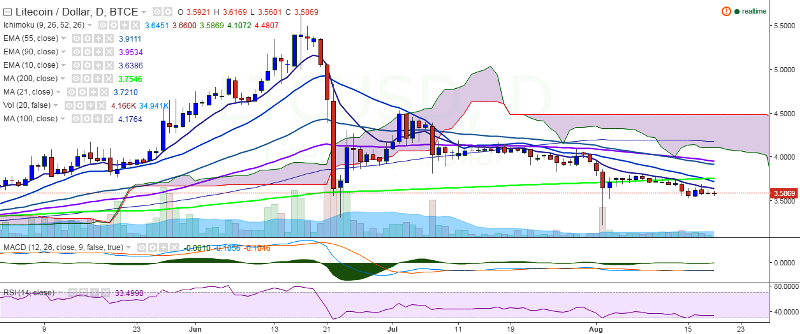
LTC/USD continues to trade in a narrow range between 3.56 and 3.61 levels on Friday, holding its ground above 3.50 levels. It is currently trading at 3.57 levels at the time of writing (BTC-e).
Ichimoku analysis (Daily chart):
Tenkan Sen: 3.65
Kijun Sen: 3.66
Trend reversal: 3.96 (90 EMA)
On the topside, the pair faces major resistance at 3.74 levels (21-day MA) and a break above would take the pair to 3.96 (90 EMA)/4.17 (100-day MA). On the downside, the pair seems to be getting strong support at 3.50 levels (psychological level) and break below would drag the pair to 3.22 (August 2 low)/3.00.