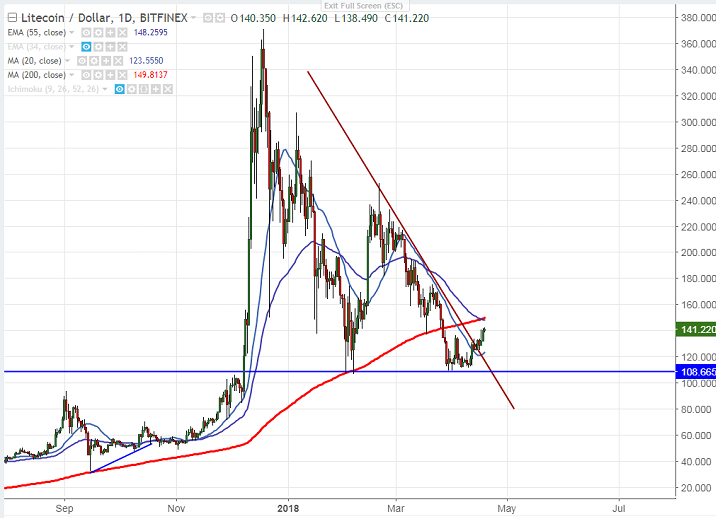
LTC/USD forms double bottom around 105, break above 200- day MA (150) confirms minor bullishness
LTC/USD shown almost 70% decline from temporary top around $370 made on Dec 19th 2017 high. The pair has formed major double bottom around 106 and shown a good jump of more than 30% till 142.62. It is currently trading a…
LTC/USD shown almost 70% decline from temporary top around $370 made on Dec 19th 2017 high. The pair has formed major double bottom around 106 and shown a good jump of more than 30% till 142.62. It is currently trading around 140.87.
The near term solid resistance is around 150 (200- day MA) and any break above will take the pair to next level till 175/195 (Mar 10th high).
On the lower side, any break below 105 confirms bearish continuation and a decline till 89/73 is possible.
It is good to buy on dips around 125-30 with SL around 105 for the TP of 175/195.