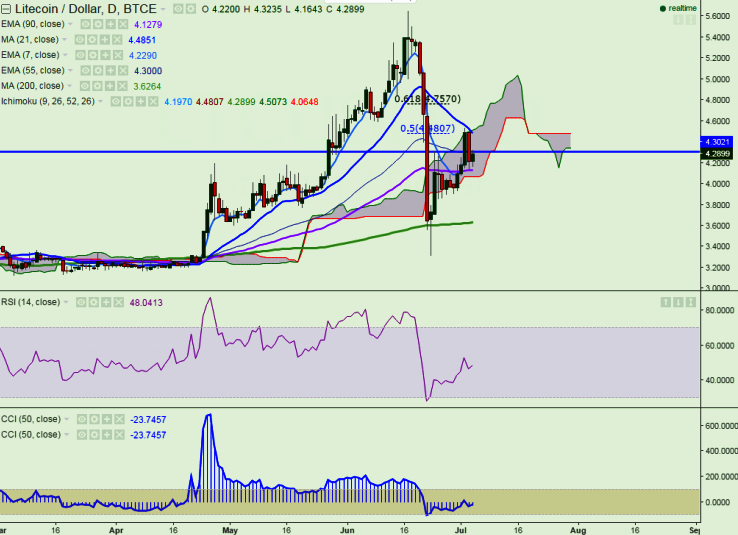
LTC/USD saw a sharp plunge after reaching a high of $4.53 levels (July 2). At the time of writing, the pair is trading in the green at $4.30 levels (BTC-e), slightly restoring its strength. Ichimoku analysis of daily cha…
LTC/USD saw a sharp plunge after reaching a high of $4.53 levels (July 2). At the time of writing, the pair is trading in the green at $4.30 levels (BTC-e), slightly restoring its strength.
Ichimoku analysis of daily chart shows:
Tenken-Sen $4.19
Kijun-Sen $4.48
Long-term trend remains bullish for the pair and it faces major resistance at $4.52 (21 day MA) and any break above confirms major bullishness , a jump till $4.84 (22 Jun high)/$5 is likely. On the flipside, major support is expected to be found at $4.08 (Jul 1 low) and break below targets $3.85 (Jun 25 low)/$3.66 (61.8% retracement of $3.31 and $4.31).
The $0.131 mark was the late-September high; a revisit would depend on Bitcoin (BTC) strengthening and crypto-market sentiment improving. No timeframe was given.
Binance US is reportedly seeking to raise up to $100 million in fresh funding at a valuation of approximately $1 billion as the cryptocurrency exchange looks to strengthen its position in the competitive U.S. market. Acc…