


 Bitcoin Bleeds $704M in ETF Outflows as Institutional Exodus Accelerates
  Ethereum Cracks Below $2,000 as Bitcoin Contagion Bites—Bearish EMA Stack Sets Sights on $1,700
  Bitcoin Buckles at $73,500: Middle East Tensions and Weak Institutional Demand Set Bearish EMA Stack on $70K Collision Course
  ETH Cracks $2,100 in Bitcoin’s Wake as Bearish EMA Stack Deepens; Sellers Target $1,900 on Rallies
  Ether Breaks Below $2,100: Triple EMA “Sell-the-Rally” Setup Targets $1,900
  FxWirePro- Major Crypto levels and bias summary
  Bitcoin Cracks $75K as $1.3B ETF Exodus and Middle East Jitters Spook Bulls; Bears Eye $70K


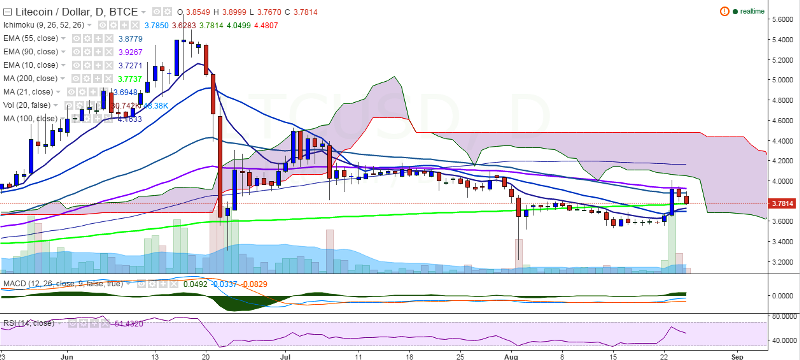
LTC/USD failed to hold its ground above 90 EMA, hit on Tuesday and has declined sharply. The pair touched major trend line 200-day MA earlier in the day and currently trades at 3.79 levels at the time of writing (BTC-e).
Ichimoku analysis of daily chart:
Tenkan Sen: 3.77
Kijun Sen: 3.63
Trend reversal: 3.93 (90 EMA)
On the topside, the pair will run into resistance at 3.93 (90 EMA) and a break above would target 4.16 (100-day MA)/4.70 (113% retracement of 4.53 and 3.22).
On the flipside, support is seen at 3.77 (200-day MA) and a break below would confirm bearishness for the pair. Any weakness below 200 DMA would target 3.50 levels and then 3.22 (August 02 low).

- News

- Economy

- Central Banks
- Investing
- Research
- Roundups
- Digital Currency
- Insights
- Technical Analysis
- Technology
- Business
- Law
- Health
- Nature
- Fintech
- Science
- Topic
- Opinions
- ©Econometrics LLC . All Rights Reserved.
LTC/USD takes support near 200-day MA, break below confirms downtrend
Thursday, August 25, 2016 11:43 AM UTC
Editor's Picks


- Market Data
Most Popular


