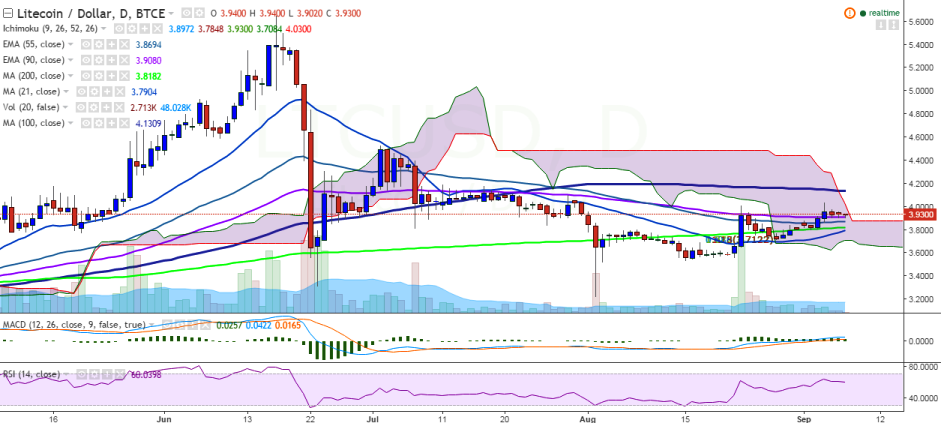
LTC/USD is continuing to trade flat, sustaining its strength just above 90 EMA. It is currently trading at 3.93 levels at press time (BTC-e).
Ichimoku analysis of daily chart:
Tenkan Sen: 3.88
Kijun Sen: 3.78
Trend reversal: 3.90 (90 EMA)
“LTC/USD must break above September 04 high of 4.03 levels for further upside”, FxWirePro said in a statement.
Major resistance is seen at 4.03 levels (September 04 high) and a break above would see it testing 4.13 levels (100-day MA)/4.53 (July 02 high).
On the flipside, the pair has taken support at 3.90 (90 EMA) and further weakness would target 3.81 (200-day MA)/ 3.71 (August 28 low)/3.51 (161.8% retracement of 3.71 and 4.03).