


 Ethereum Cracks Under $1,700: Sell the Rally Near $1,750 as Bears Eye $1,380–$1,200
  FxWirePro- Major Crypto levels and bias summary
  FxWirePro- Major Crypto levels and bias summary
  FxWirePro- Major Crypto levels and bias summary


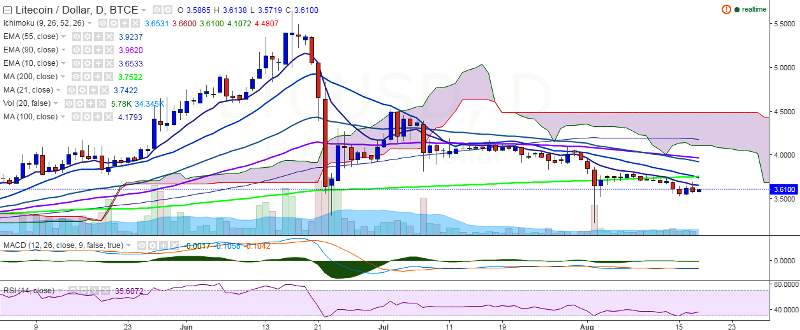
LTC/USD continues to trade flat on Thursday and currently trades at 3.60 levels at the time of writing (BTC-e). The pair seems to have taken support near 3.50 levels and is trying to sustain above this levels.
Ichimoku analysis of daily chart:
Tenkan Sen: 3.65
Kijun Sen: 3.66
Trend reversal: 3.74 (200-day MA)
On the topside, the pair faces major resistance at 3.74 levels (200-day MA) and a break above would take the pair to 3.97 (90 EMA)/4.18 (100-day MA). On the flipside, support is likely to be found at 3.50 levels (psychological level) and break below would drag the pair to 3.22 (August 2 low)/3.00.

- News

- Economy

- Central Banks
- Investing
- Research
- Roundups
- Digital Currency
- Insights
- Technical Analysis
- Technology
- Business
- Law
- Health
- Nature
- Fintech
- Science
- Topic
- Opinions
- ©Econometrics LLC . All Rights Reserved.
LTC/USD trades flat, takes support close to 3.50
Thursday, August 18, 2016 11:16 AM UTC
Editor's Picks


- Market Data
Most Popular


