


 FxWirePro- Major Crypto levels and bias summary
  Ethereum Cracks Under $1,700: Sell the Rally Near $1,750 as Bears Eye $1,380–$1,200
  FxWirePro- Major Crypto levels and bias summary
  BTC’s Bear Bounce: Sell the Rally Near $66K as Bears Target $59K–$52K Breakdown


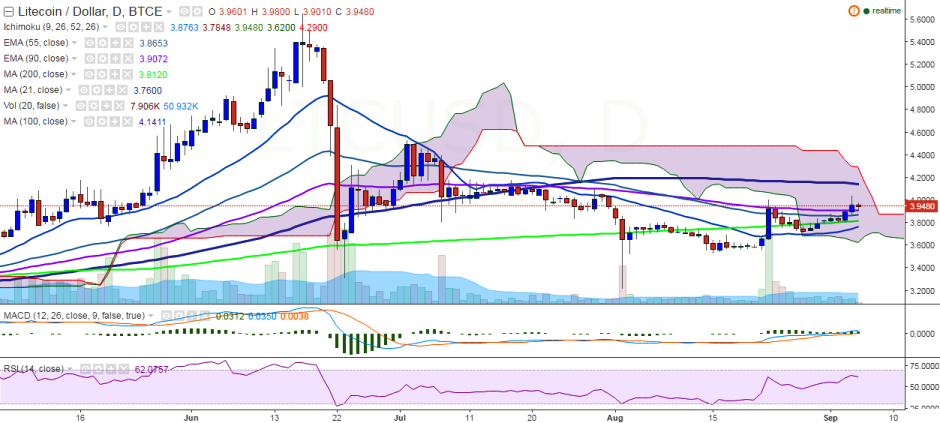
LTC/USD has once again failed to break above 4.00 levels and currently trades at 3.93 levels at press time (BTC-e).
Ichimoku analysis of daily chart:
Tenkan Sen: 3.87
Kijun Sen: 3.78
Trend reversal: 3.90 (90 EMA)
“LTC/USD is showing a slight dip after hitting 4.03 levels on September 04 and is trading close to 90 EMA. The pair must break above 4.00 levels for further upside”, FxWirePro said in a statement.
The pair will run into resistance at 4.14 levels (100-day MA) and a break above would see it testing 4.53 levels (July 02 high)/4.70 (113% retracement of 4.53 and 3.22).
On the flipside, 3.90 (90 EMA) is likely to act like a strong support for the pair and a break below would target 3.80 (200-day MA)/3.51 (161.8% retracement of 3.71 and 4.03).

- News

- Economy

- Central Banks
- Investing
- Research
- Roundups
- Digital Currency
- Insights
- Technical Analysis
- Technology
- Business
- Law
- Health
- Nature
- Fintech
- Science
- Topic
- Opinions
- ©Econometrics LLC . All Rights Reserved.
LTC/USD trades in the red, scope for further upside only above 4.00
Monday, September 5, 2016 10:32 AM UTC
Editor's Picks


- Market Data
Most Popular


