


 FxWirePro- Major Crypto levels and bias summary
  FxWirePro- Major Crypto levels and bias summary


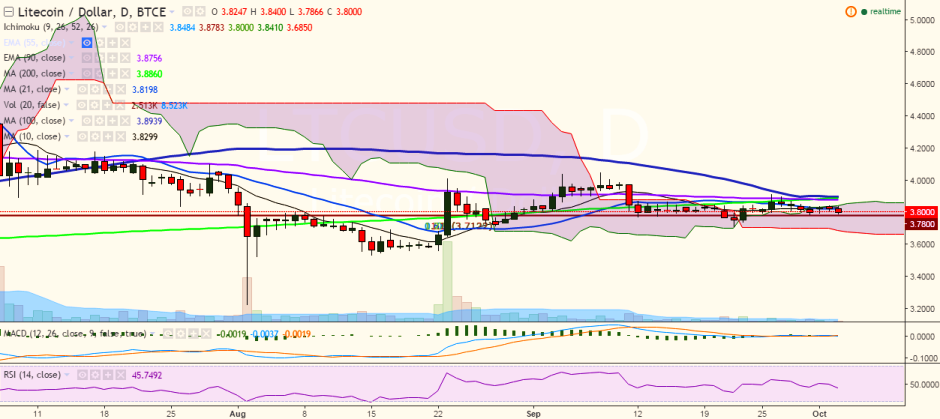
LTC/USD has hit a fresh low of 3.79 levels so far in the day, after it touched 3.843 levels on October 02. It is currently trading at 3.80 levels (BTC-e).
Short-term trend: Bearish
Ichimoku analysis of daily chart:
Tenkan Sen: 3.84
Kijun Sen: 3.87
Trend reversal: 3.87 (90 EMA)
“The pair has failed to break above the Ichimoku cloud and is inching closer to September 30 low of 3.78 levels. Further bearishness would be seen only below 3.70 levels ”, FxWirePro said in a statement.
On the topside, the pair faces resistance at 3.84 (Tenkan Sen) and a break above would take the pair to 3.88 (200-DMA)/ 3.91 (September 26 high)/ 4.05 (September 08 high).
On the other hand, support is seen at 3.78 (September 30 low) and any violation would target 3.70 (September 22 low)/3.50 (psychological level).

- News

- Economy

- Central Banks
- Investing
- Research
- Roundups
- Digital Currency
- Insights
- Technical Analysis
- Technology
- Business
- Law
- Health
- Nature
- Fintech
- Science
- Topic
- Opinions
- ©Econometrics LLC . All Rights Reserved.
LTC/USD trades weaker, break below 3.78 targets 3.70
Monday, October 3, 2016 11:58 AM UTC
Editor's Picks


- Market Data
Most Popular


