


 FxWirePro- Major Crypto levels and bias summary
  FxWirePro- Major Crypto levels and bias summary


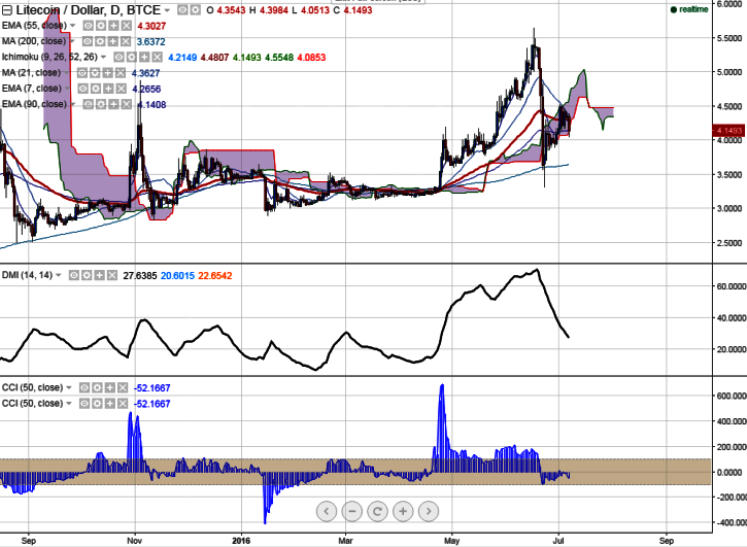
LTC/USD showed major weakness on Thursday, plunging to $4.05 levels. It is currently trading at $4.14 levels (BTC-e) at the time of writing.
Ichimoku analysis of daily chart shows:
Tenkan-Sen $4.21
Kijun-Sen $4.48
Trend reversal - $4.135
“The pair has briefly broken below 90 EMA and continues to hover around this level. A consistent break below would suggest further weakness in the pair”, FxWirePro said in a statement.
Major resistance is seen at $4.42 (21 day MA) and any break above confirms major bullishness, a jump till $4.84 (22 Jun high)/$5. On the flip side, major support is likely to be found at $4.14 (90 day EMA) and break below will drag the pair to $3.85 (Jun 25 low)/$3.66 (61.8% retracement of $3.31 and $4.31).

- News

- Economy

- Central Banks
- Investing
- Research
- Roundups
- Digital Currency
- Insights
- Technical Analysis
- Technology
- Business
- Law
- Health
- Nature
- Fintech
- Science
- Topic
- Opinions
- ©Econometrics LLC . All Rights Reserved.
LTC/USD trades weaker, dip till $3.66 likely
Thursday, July 7, 2016 11:28 AM UTC
Editor's Picks


- Market Data
Most Popular


