


 FxWirePro- Major Crypto levels and bias summary
  FxWirePro- Major Crypto levels and bias summary
  Ethereum Cracks Under $1,700: Sell the Rally Near $1,750 as Bears Eye $1,380–$1,200
  BTC’s Bear Bounce: Sell the Rally Near $66K as Bears Target $59K–$52K Breakdown


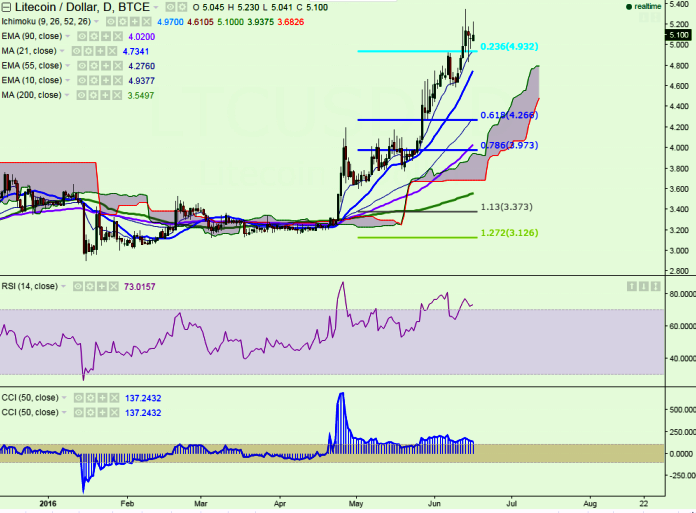
LTC/USD is currently trading at 5.12 levels, after hitting 5.23 levels earlier in the day (BTC-e). Ichimoku analysis of daily chart shows:
Tenkan-Sen level: 4.97
Kijun-Sen level: 4.6
Trend reversal level - (90 day EMA) - 3.99
Long term trend remains bullish and the pair faces resistance at 5.41 levels (1.13% retracement of 5.35 and 4.834 levels), and a consistent break above would see the pair reaching 5.66 levels and then to 6.18 levels. On the reverse side, support is seen at $4.93 (23.6% retracement of $5.35 and $3.6) and any weakness below this level will see the pair dropping $4.50/$4.18 (55 day EMA).
“LTC/USD has taken support at 10 EMA, so a jump till 5.44 seems likely”, said FxWirePro in a statement.

- News

- Economy

- Central Banks
- Investing
- Research
- Roundups
- Digital Currency
- Insights
- Technical Analysis
- Technology
- Business
- Law
- Health
- Nature
- Fintech
- Science
- Topic
- Opinions
- ©Econometrics LLC . All Rights Reserved.
LTC/USD turns green, jump till 5.44 likely
Thursday, June 16, 2016 12:04 PM UTC
Editor's Picks


- Market Data
Most Popular


