


 GBPUSD, AUDUSD & NZDUSD Turn Extremely Bullish: Strong Positive Momentum Drives Major Pair Action Bias
  FxWirePro- Woodies pivot (Major)
  FxWirePro: AUD/USD remains buoyant, looks to extend gains
  FxWirePro- Woodies pivot (Major)
  FxWirePro: GBP/NZD gains some upside momentum but still bearish
  FxWirePro: EUR/AUD outlook weaker on renewed downside pressure
  FxWirePro: AUD/USD edges lower, but bullish outlook persists
  Major Pair Action Bias: Extremely Bullish Surge Powers GBPUSD & NZDUSD as Bullish Momentum Ignites
  FxWirePro: USD/CAD falls after BoC rate hold and weak U.S. producer inflation
  GBPJPY Bullish on Consolidation: Holds Above 216 After 218 Top – Buy Dips at 217 Targeting 220
  FxWirePro- Major Pair levels and bias summary
  Gold Loses Steam After Strong U.S. Retail Sales
  FxWirePro- Major Crypto levels and bias summary
  AUDJPY Bullish Surge: Strong Australian Dollar Fuels Fresh Upside as Pair Holds Above 113.50 and All EMAs Align
  ETH Stands Alone Bullish; BTC, SOL, XRP, BNB Neutral
  FxWirePro: USD/JPY uptrend loses steam, remains on bullish path


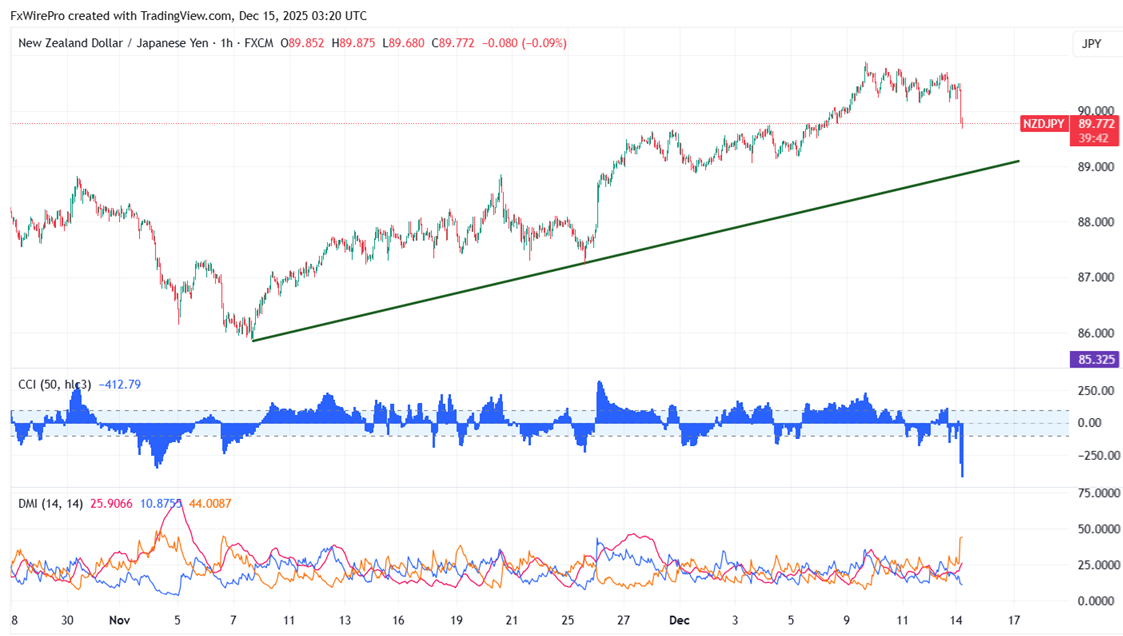
As the New Zealand dollar lost its speed, NZDJPY trades below the 90 level. The intraday trend is downward as long as the resistance at 90.90 holds. The pair fell intraday to 89.78; it now trades about 89.86.
Oscillators and moving averages to forecast the trend of NZDJPY
CMP- 89.857
EMA (1-hour chart)
55-EMA- 90.43
200-EMA- 90.02
365-EMA- 89.54. The pair trades below the short (55 EMA) and above long-term moving average(200 and 365).
Major support- 89.50. Any breach below will drag the pair down to 89.30/88.70/88.40/87.99/87.20/86.65/85.37/85.
Major resistance - 90.10. Any break above 90.10 confirms minor bullishness, a jump to 90.60/91/91.39/92.
Indicator (1-hour chart)
CCI (50)- bearish
Average directional movement Index- Bearish. All indicators confirm a Bearish trend.
It is good to sell on rallies around 90.18-20 with SL around 90.90 for a TP of 88.


