
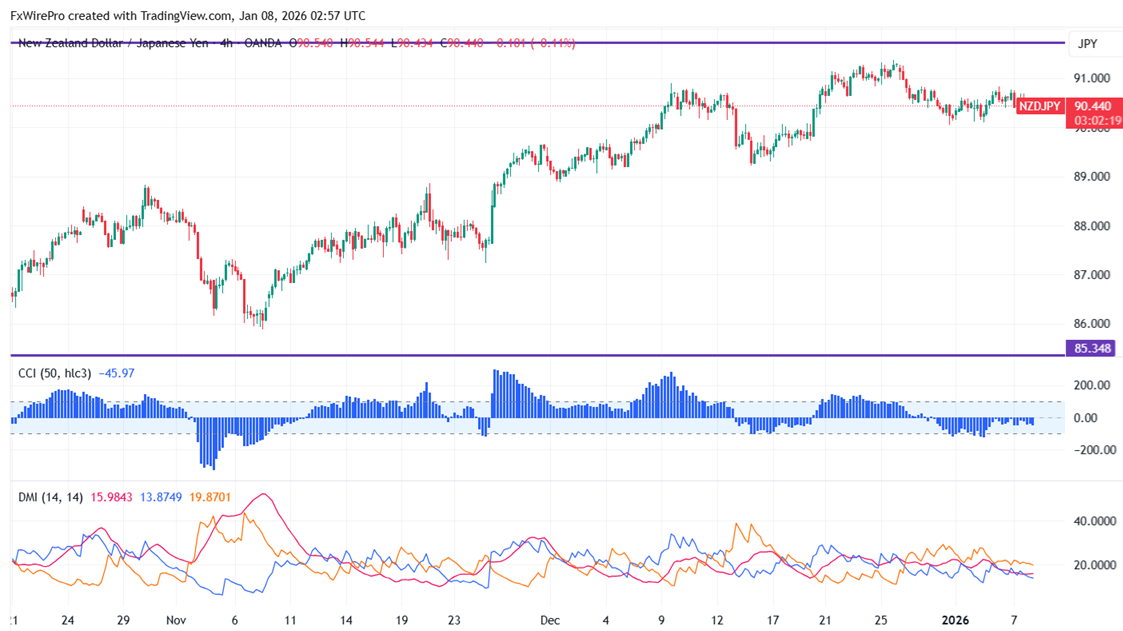
NZDJPY trades in narrow range with no proper direction. The intraday trend is bearish as long as opposition at 91.50 continues. The couple reached an intraday low of 90.43; currently trades at roughly 90.486.
Oscillators and moving averages to forecast the trend of NZDJPY
CMP- 90.49
EMA (4-hour chart)
55-EMA- 90.52
200-EMA- 89.84
365-EMA- 89.13. The pair trades below the short (55 EMA) and above long-term moving average(200 and 365).
Major support- 90. Any breach below will drag the pair down to 90/89.70/89.20/88.70/88.40/87.99.
Major resistance - 90.85. Any break above 90.85 confirms minor bullishness, a jump to 91.50/92/93.
Indicator (4- hour chart)
CCI (50)- bearish
Average directional movement Index- Neutral. All indicators confirm a mixed trend.
It is good to sell on rallies around 91 with SL around 91.50 for the TP of 89.20.


