


 FxWirePro -Major European Indices
  FxWirePro- Major Pair levels and bias summary
  FxWirePro: USD/CAD extends decline on broad dollar weakness
  Bitcoin’s Volatile Reset: ETFs Rebound as Bulls Eye USD 80,000 Milestone
  FxWirePro: USD/CNY neutral in the near-term, scope for downward resumption
  FxWirePro- Major European Indices
  Bitcoin’s Islamabad Watch: BTCUSD Consolidates Near 71,421 USD as Geopolitical Peace Talks Loom
  NZDJPY Bulls Charge Toward 95.00: Safe-Haven Exodus Drives Kiwi Rally
  FxWirePro: EUR/CAD gains ground on prospects of resumed energy flows
  FxWirePro: GBP/USD bulls remain cautiously optimistic
  FxWirePro- Major Pair levels and bias summary
  FxWirePro: EUR/AUD under pressure as key support gives way
  FxWirePro- Major Crypto levels and bias summary
  FxWirePro:NZD/USD uptrend loses momentum but bullish setup remains
  Energy Surge Ignites US Inflation: USDCHF Eyes Support Amid Dollar Sell-Off


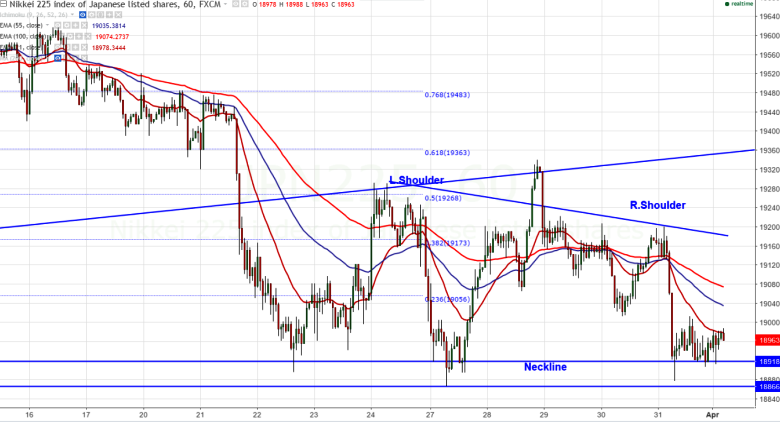
- Pattern Formed - Head and shoulder .
- Major support - 18867 (100- day EMA)..
- Major resistance - 19364 (61.8% retracement of 19669 and 18867).
- Nikkei has declined after showing a jump till 19200 yesterday. The index broken 19000 level and declined till 18878. It is currently trading at 18978 at 0.16% higher.
- The index formed head and shoulder pattern in hourly chart any break below neckline at 18870 will confirm bearish continuation.
- USD/JPY declined after jumping till 112.19 and any break above 112.20 (100- day EMA) confirms further bullishness. Minor weakness can be seen below 110 level.It is currently trading around 111.35.
- On the lower side , 18867 (100- day MA) and any break below will drag the index till 18650/18230..
- •The major resistance is around 19365 (61.8% retracement of 19669 and 18867) and any break above will take the index till 19600/19698.The minor resistance is around 19030/19200.
It is good to sell below 18870 around with SL around 19030 for the TP of 18635/18500


