


 FxWirePro: GBP/NZD remains buoyant, looks to extend gains
  FxWirePro- Major Crypto levels and bias summary
  FxWirePro:NZD/USD drifts lower, could be on verge of bigger drop
  FxWirePro: AUD/USD recovers slightly from early decline but bears are not done yet
  Bitcoin Battles Volatility: Institutional Support Eyes USD 64,000 Floor Amid Geopolitical Tensions
  Kiwi Under Pressure: NZDJPY Signals Bearish Turn as Resistance at 92.00 Holds Firm
  FxWirePro: USD/ZAR sustains gains as uptrend remains strong
  NZDJPY Bears Take Control: New Zealand Dollar Retreats as 92 Resistance Holds Firm
  Pound Under Pressure as Yen Stabilizes: GBPJPY Bears Target 208 as Key EMAs Hold Resistance
  FxWirePro: EUR/AUD gaining momentum for a move towards 1.6800 level
  FxWirePro: EUR/AUD eases slightly but trend is still bullish
  FxWirePro: EUR/ NZD consolidating around 2.0180 room for further gains
  FxWirePro: USD/JPY firms as Trump's address on Gulf war spark fresh concerns
  FxWirePro: GBP/USD outlook weaker on renewed downside pressure
  Aussie Ascent: AUDJPY Reclaims 110.00 as Bullish Momentum Ignites


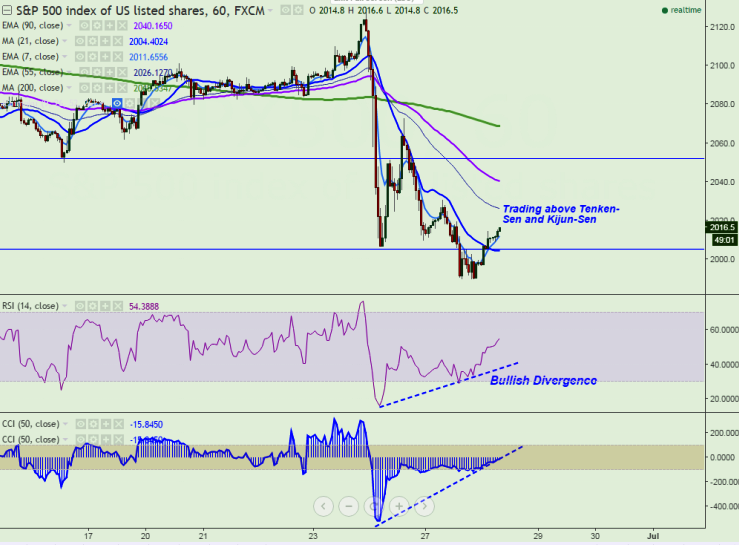
- Major intraday resistance -2010 (Hourly Kijun-Sen)
- Major intraday support- 2000
- Pattern Formed (Hourly chart)- Bullish divergence (CCI (50) and RSI (14).
- The index has recovered after making a low of 1989. It is currently trading around 2012.80.
- The S&P500 is trading slightly well above 2010 (hourly Kijun-Sen) and a jump till 2026 (55 H EMA)/2040 (61.8% retracement of 2072 and 1989).
- The index should break above 2072 for the bearish trend from 2127 till 1989 to complete. Any break above 2072 targets 2100/2120/2127.
- On the lower side , major support is around 2000 and break below will drag the index down till 1989/1972/1960.
It is good to buy at dips around 2010 with SL around 2000 for the TP of 2026/2040


