


 FxWirePro: AUD/USD recovers slightly from early decline but bears are not done yet
  Aussie Ascent: AUDJPY Reclaims 110.00 as Bullish Momentum Ignites
  Ethereum Retreats Toward USD 2,000: Technicals Signal Caution as ETH Mimics Bitcoin’s Pullback
  Pound Under Pressure as Yen Stabilizes: GBPJPY Bears Target 208 as Key EMAs Hold Resistance
  Bitcoin Resilience: BTC Reclaims USD 69,000 as Geopolitical Tensions Ease
  Kiwi Under Pressure: NZDJPY Signals Bearish Turn as Resistance at 92.00 Holds Firm
  FxWirePro: USD/ZAR sustains gains as uptrend remains strong
  FxWirePro- Major Crypto levels and bias summary
  FxWirePro- Major European Indices
  FxWirePro: USD/JPY firms as Trump's address on Gulf war spark fresh concerns
  FxWirePro- Woodies Pivot(Major)
  FxWirePro- Woodies Pivot(Major)
  FxWirePro: GBP/USD outlook weaker on renewed downside pressure
  FxWirePro: GBP/NZD remains buoyant, looks to extend gains


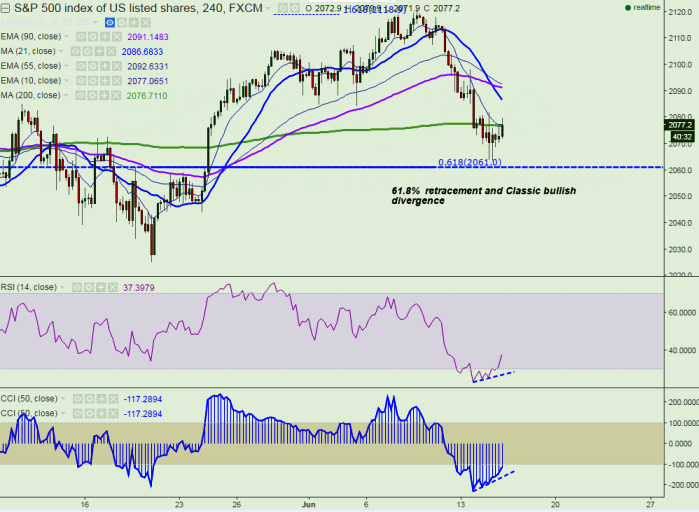
- Pattern formed – classic bullish divergence
- Potential Reversal Zone- 2060
- S&P500 has recovered after making a low of 2063.70.it is currently trading around 2078. Short term trend is lightly bullish as long as support 2060 holds.
- Any indicative break below 2060 will drag the index down till 2052 (90 day EMA)/2044.
- S&P500 index resistance is around 2077 (200 4H MA) and any break above targets 2088/2093/2108.50.
It is good to buy at dips around 2072-75 with SL around 2060 for the TP of 2098/2108


