
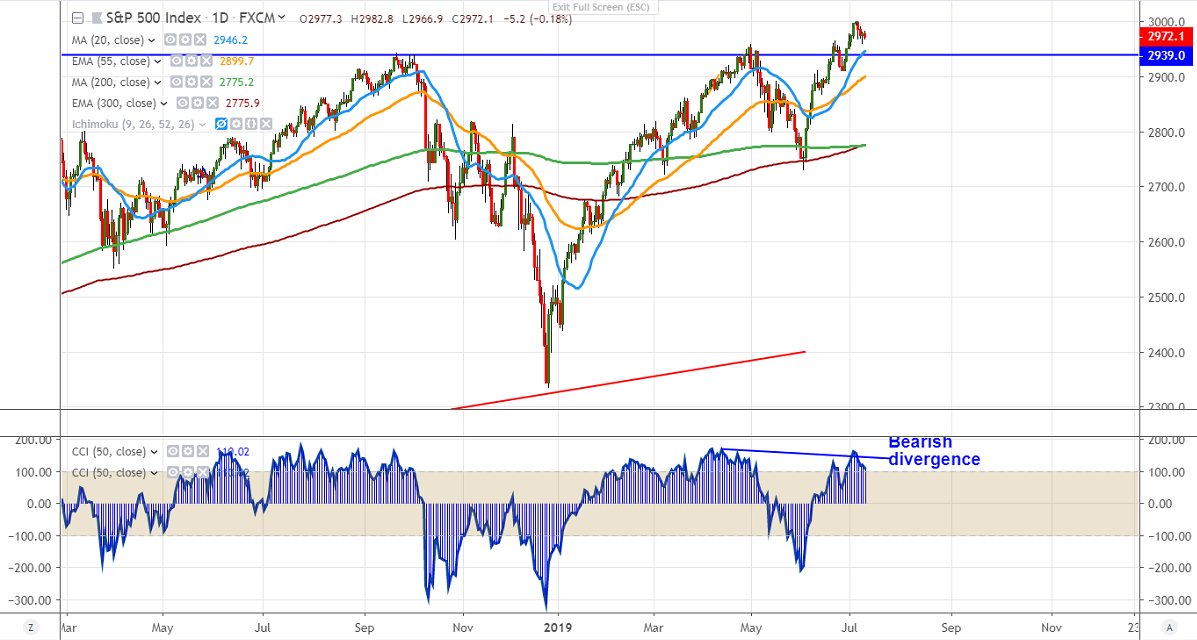
Bearish divergence (daily CCI (50) and RSI)
As per our analysis, S&P500 has lost nearly 40 points from the all-time high of 2999.The index was trading higher for the past four weeks and jumped more than 3% from low of 2728. Markets already factored 25bpbs point cut and his testimony will have more impact on expectations for Fed rate cuts in Sep and coming months. It is currently trading around 2970.60.
US 10 year bond yield continues to trade higher for the past four trading days and recovered nearly 9% from 1.93% lowest level since 2016. It is currently trading around 2.09%.
The index's near term major resistance is at 3000 (161.8% fib) and any convincing break above will take to the next level till 3025/3050.
On the flip side, near term support is around 2955 (38.2% fib) and any indicative break below will take the index till 2941 (20- day MA)/2910 (Jun 26th low).
It is good to sell on rallies around 2982-84 with SL around 3000 for the TP of 2910.


