


 FxWirePro: GBP/AUD bears maintain upper hand
  Major European Indices Score Extremely Bullish: DAX Eyes 26000, CAC Targets 8600, FTSE100 at 11000 – Key Levels to Watch
  FxWirePro: USD/ZAR gains as stronger dollar outweighs upbeat South Africa's trade surplus
  NZDJPY Retreats on Yen Strength – Bearish Setup Targets 90 After Hitting 92.75 Low
  NZDJPY Bullish Rebound: Buy Dips as EMAs Align for 97 Target
  Major FX Action Bias & US Market Sentiment: NZD/USD (Extremely Bullish) & AUD/USD (Bullish) Watchlist
  FxWirePro- Major Pair levels and bias summary
  FxWirePro: USD/CNY dips to hit three year low,scope for further downside
  FxWirePro: NZD/USD consolidates overnight gains, but loses momentum
  AUDJPY Volatile After Massive Sell-Off: Sell Rallies at 113, Targeting 110 as Bearish Momentum Surges
  FxWirePro:USD/JPY climbs back above 160.00 after BOJ rate decision
  US Magnificent 7 Stocks Trend Score: Amazon & Microsoft Hit Extreme Bullish (+100) as Meta Drops to -100 — Key Resistance & Support Watchlist
  FxWirePro- Woodies pivot (Major)
  Nikkei Surges Past 65,000 on Suspected Yen Weakness: Tech Giants Like Advantest and NEC Lead Explosive Gains
  FxWirePro: USD/CAD retreats after Canada posts stronger-than-expected GDP growth


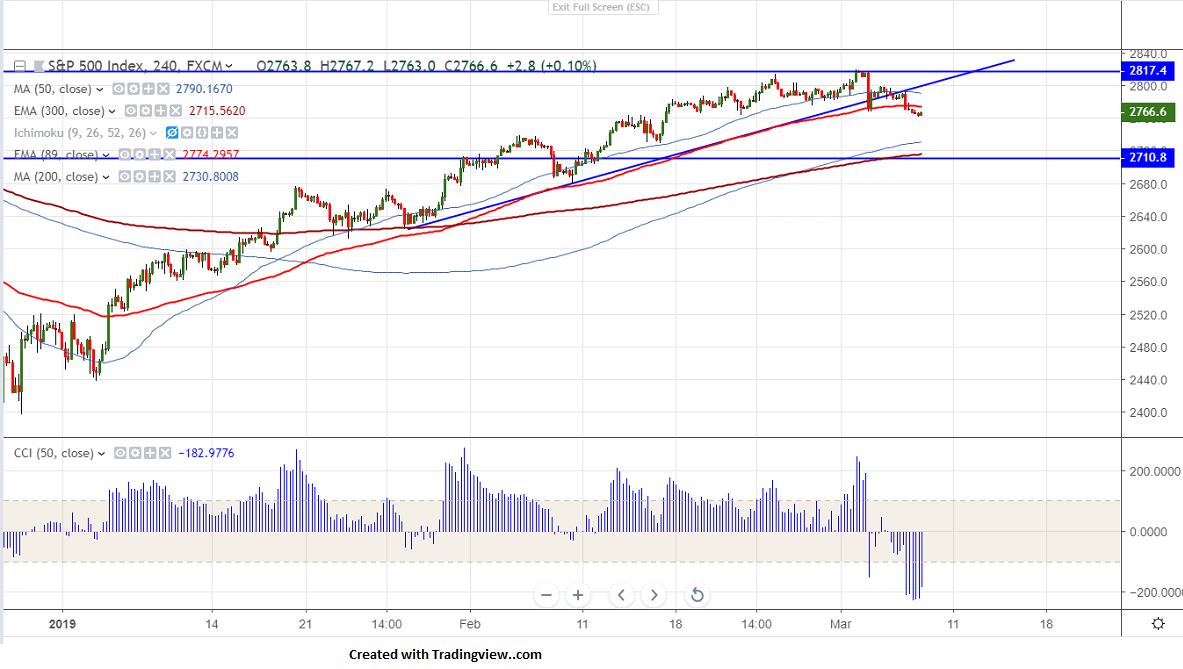
Chart pattern- Double top
Major resistance- 2820
S&P500 trades weak for past three trading day after a continues jump for past more than 2- month. The index recovered more than 20% from low of 2334 level on account of easing trade tensions between US-China. It has formed temporary top around 2820 and is currently trading around 2765.40
The near term major support is around 2748 and any violation below will drag the index till 2732/2715 (300- 4H EMA)/2700. Any violation below 2680 confirms further weakness.
On the higher side, minor resistance is around 2800 and any break above will take the index to next level 2820.It should break above 2820 for further bullishness.
It is good to sell on rallies around 2790-95 with SL around 2820 for the TP of 2745/2700.


