
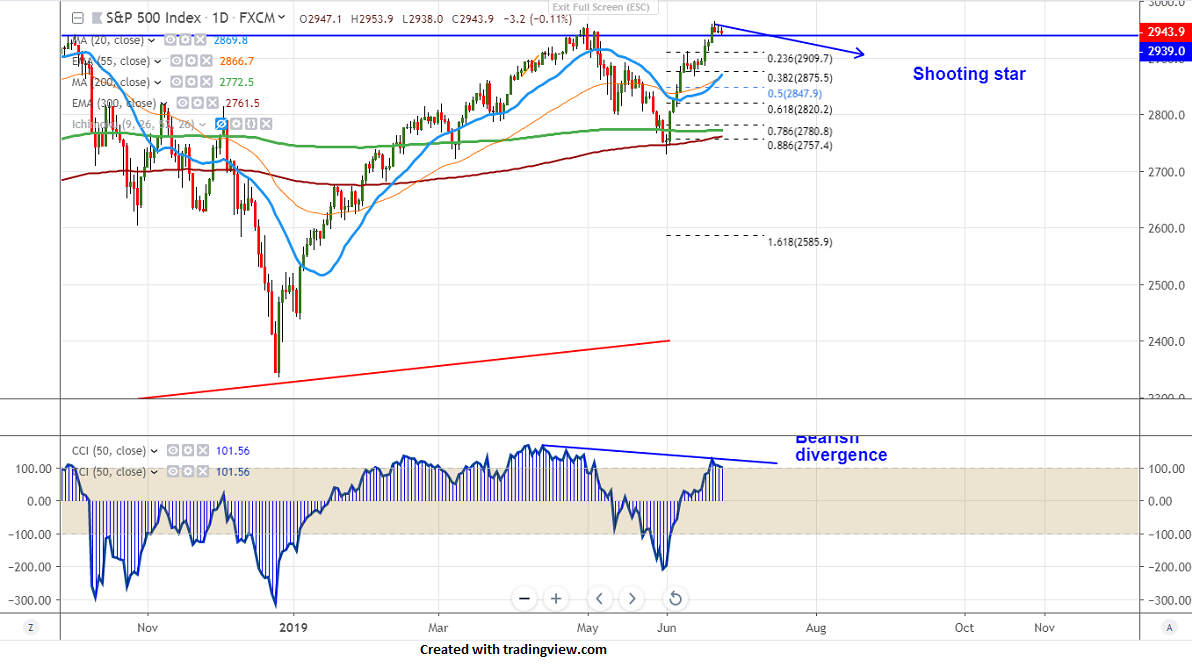
Candlestick pattern- Shooting star
Bearish divergence (CCI)
S&P500 has halted its 15-day bullishness and shown a minor decline. The index hits all-time high and jumped more than 200 points from low of 2728 made on Jun 3rd 2019. The jump was due to a slight easing of trade war tension between the US and China. It hits intraday low of 2938 and is currently trading around 2943.
Technically the pair is facing minor support at 2925 (7-- day MA) and any violation below will drag index to next level till 2909 (23.6% fib)/2862-66 (20- day MA and Jun 13th 2019).
On the higher side, the high made on Jun 21st 2965 will be acting as near term resistance and any break above targets 2982/3000.
It is good to sell on rallies around 2945-50 with SL around 2970 for the TP of 2867


