
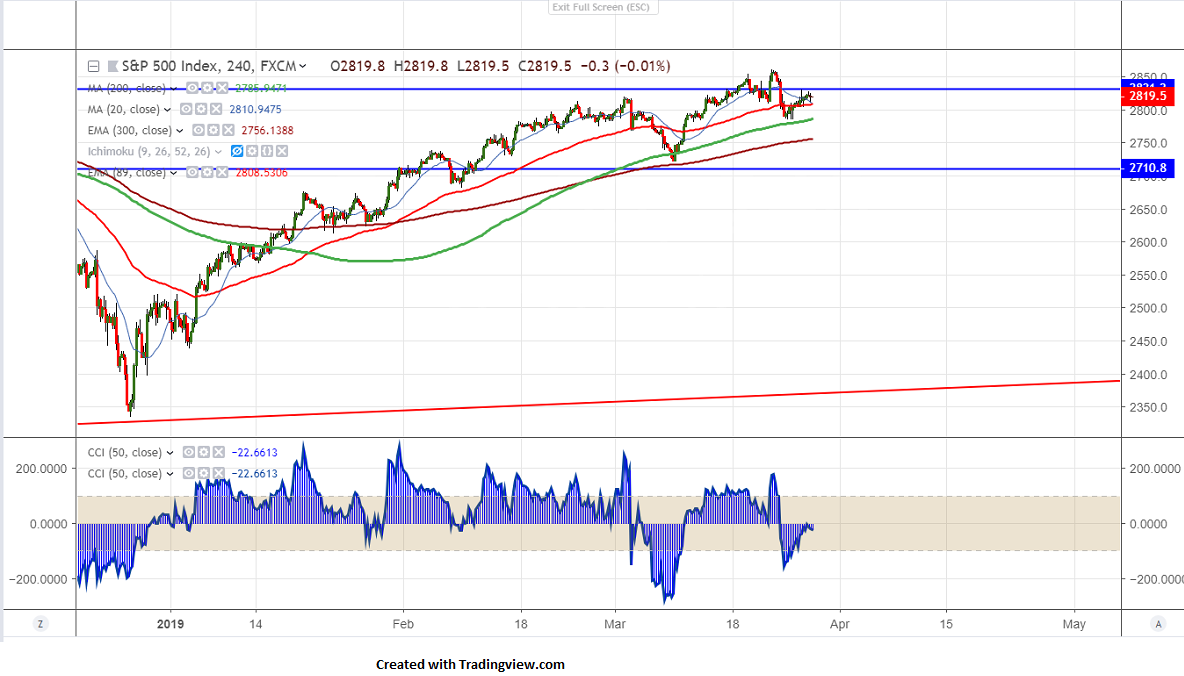
Candle stick pattern- Long legged Doji and Shooting star
S&&P500 has halted its downtrend after massive sell-off of more than 2.5% on account of declining US 10 year yield. US 10 year yield hits low of 2.37% first since Dec 2017. US 10 year yield trades below 3 month yield (yield curve inversion for first time since 2007). The index hits high of 2830 yesterday and is currently trading around 2818.80.
The near term support is around 2775 (61.8% fib) and any break below will take the index to next level till 2753 (200- day MA)/2720-30 (89- day EMA). Any break below 2720 confirms further weakness.
On the lower side, resistance is at 2820 and any violation above targets 2840/2860. Any break above will take the index till 2900/2930.
It is good to sell on rallies around 2820-25 with SL around 2845 for the TP of 2753/2720.


