
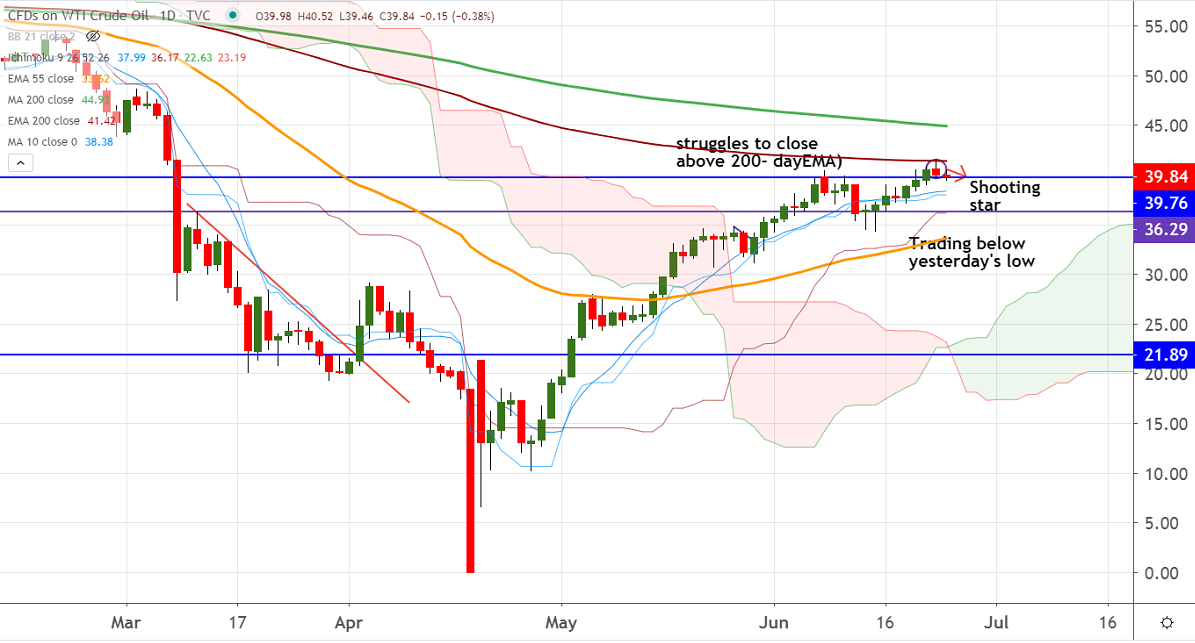
Candlestick- Shooting star
Ichimoku Analysis (Daily Chart)
Tenken-Sen- $37.99
Kijun-Sen- $36.17
WTI crude oil has halted its 2 –month of an uptrend and shown more than $2 of decline. It was one of the best performers in the past 2-month and surged more than 500% from a low of $6.60 level. The easing of lockdown and optimism in COVID-19 is the main reason behind this rally. But upside will be capped due to ongoing US-China trade war and fear of the second wave of coronavirus.
Technically, the commodity has shown a minor jump above 200-day EMA ($41.43) and started to decline. It confirms secondary weakness, a dip till $37.33 (21 –day MA)/$36.42 likely.
On the higher side, a significant move can be seen if it breaks $41.65 (yesterday's high). Any indicative violation above targets $43/$45.
It is good to sell on rallies around $40.15-20 with SL around $41.65 for the TP of $37.23/$36.45.


