
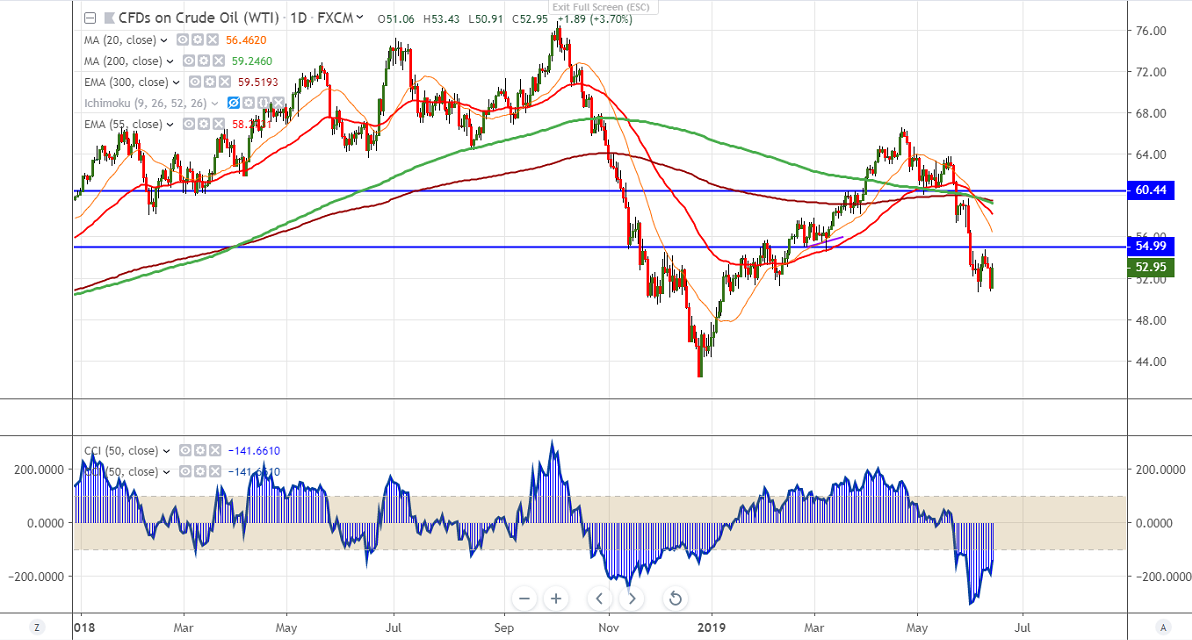
US Oil recovered till $54.80 after forming a bottom around $50.59 on Jun 5th 2019. After a minor jump US oil lost more than 7% and plunged more than 4% yesterday. The reason was due to
- Ongoing US-China trade war and US inverted yield curve signals demand for crude oil might get reduced in coming days.
- US EIA crude oil inventories came at weaker than expected and shows sign of rise in supplies. It jumped by 2.2 million barrels for the week ended Jun 7th compared to forecast of -1.0 million barrels.
Technically oil has formed almost a double bottom around $50 and once gain jumped after reports came two tankers was “suspected to be hit by a torpedo” in Gulf of Oman near Iran and Strait Hormuz.
The commodity made high of $54.80 on Jun 10th 2019 which will be acting as near term resistance and any convincing break above will take the US oil till $56.40 (20- day MA)/$58.47. Any major trend reversal only above $60.
Major weakness below $50 and any violation below confirms bearish continuation, a dip till $48.10/$46.65.
It is good to sell on rallies around $55 with SL around $56.555 for the TP of $50/$48.15.


