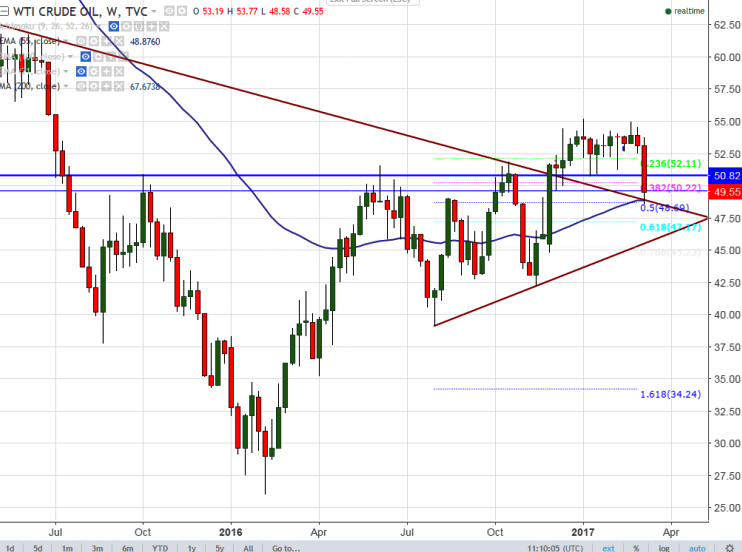
Major support - $48.65 (trend line joining $62.56 and $51.91) Major short term resistance - $50.75 (support turned into resistance). US oil declined most in a year on Wed after US crude inventories climbed for the ninth …
Major support - $48.65 (trend line joining $62.56 and $51.91)
Major short term resistance - $50.75 (support turned into resistance).
US oil declined most in a year on Wed after US crude inventories climbed for the ninth consecutive week to a record high. It has rose by 8.2 million barrels last week to a record 528.4 million barrels.
US oil has broken major support of $50 and declined below $49 for the first time since Nov 2016.
On the lower side, any weekly close below $50 confirms further weakness, a decline till $47.25 (50% retracement of $39.23 and $55.21)/$45 likely.
Short term resistance is around $50.75 and any break above will take the commodity till $51.91/$52.68 (61.8% retracement of $55.21 and $48.58).
Overall bearish invalidation only above $55.
It is good to sell on rallies around $50-$50.10 with SL around $51.90 for the TP of $47.25/$45