


 FxWirePro: USD/JPY holding bid into weekend
  Bitcoin’s Volatile Reset: ETFs Rebound as Bulls Eye USD 80,000 Milestone
  FxWirePro: USD/ZAR recovers slightly but trend is still bearish
  FxWirePro: EUR/AUD downtrend loses steam but outlook still bearish
  NZDJPY Bulls Charge Toward 95.00: Safe-Haven Exodus Drives Kiwi Rally
  Euro Holds the Line: EURUSD Finds Support at the 365-EMA as Peace Talks Loom
  FxWirePro: GBP/NZD up trend gains some momentum but hurdles ahead
  Energy Surge Ignites US Inflation: USDCHF Eyes Support Amid Dollar Sell-Off
  FxWirePro: EUR/AUD under pressure as key support gives way
  FxWirePro- Major European Indices
  FxWirePro: GBP/AUD positions for another drop, eyes 1.8900level
  FxWirePro: GBP/USD bulls remain cautiously optimistic
  FxWirePro: EUR/CAD gains ground on prospects of resumed energy flows
  FxWirePro- Woodies Pivot(Major)
  FxWirePro: USD/ZAR edges lower ,investors remain on edge


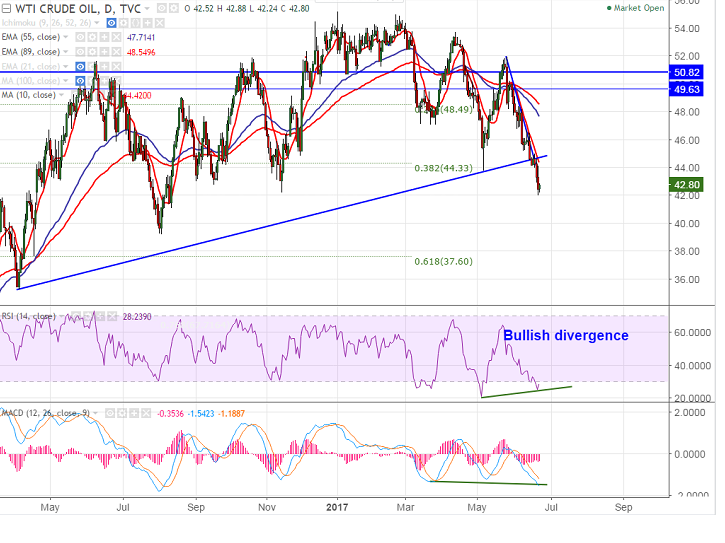
- US oil has shown a huge decline and hits 10 month after U.S government data revealed a rise in shale gas production. Black gold declined till $42.07 and shown a minor jump after slightly better than expected U.S crude inventory report.
- U.S crude oil inventories fell more than expected last month .The inventories declined 2.5 M compared to forecast of -2.106M.
- Technically US oil has formed bullish divergence in the daily chart, a minor jump till $43.91/$44.70 (10- MA) likely.
- The near term support is around $42 and any break below will drag the US Oil till $40/$39.23 (Aug 3rd low).
It is good to buy on dips around $42.75-$42.80 with SL around $42 for the TP of $43.90/$44.70.
FxWirePro launches Absolute Return Managed Program. For more details, visit http://www.fxwirepro.com/invest


