


After three hikes in 2017, the U.S. Federal Reserve hiked four times in 2018 as inflation was edging higher. In 2019, as energy prices eased, FOMC forecasted two more rate hikes only to retract it at the March meeting.
With economic uncertainty and the possibilities of recession around the corner, the U.S. Federal Reserve has adopted an ‘as it happens’ approach, which makes the incoming numbers especially inflation, GDP, and employment of extreme importance.
As of now, the bond market is pricing no rate hike in 2019, and pricing a rate cut with a 57.8 percent probability.
Why inflation data important?
- Fed’s dual mandate is price stability and maximum employment. The Unemployment rate has now reached 3.8 Percent in the US, which is the long term unemployment level, consistent with the Fed’s dual mandate. That leaves inflation to be the most vital mandate for subsequent hikes.
- As inflation expectations increased, the fed had projected two rate hikes until the end of 2019. But as the economy weakened it retraced the move. The current Federal Funds rate is at 2.25-2.50 percent. Hence, the actual inflation would decide the next move.
- As forecasted, the inflation numbers are proving to be a key determinant of exchange rate divergence among major economies in recent years.
Past trends –
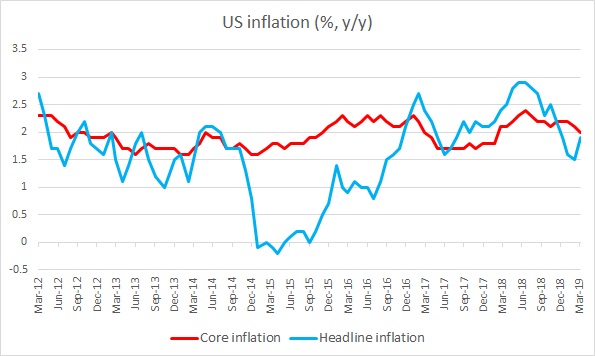
- After staying below FED’s 2 percent target, headline CPI fell to negative territory in the final quarter of 2014. In January CPI fell by -0.7 percent on a monthly basis, mostly due to lower energy prices. Yearly CPI fell by -0.1 percent y/y in January.
- Yearly change in CPI has been minimal since then, growing about 0.04 percent per month.
- Yearly CPI growth was +0.7 percent in December 2015, the first sign of a comeback.
- In Mach 2016 it showed further signs of a bounce back, with 0.9 percent y/y. The consumer price index was up 1 percent in June 2016 and 0.8 percent in July on a yearly basis. In August it picked up further to 1.1 percent y/y. It rose again in September by 1.5 percent and by 1.6 percent in October. It rose further to 1.7 percent in November. 2016 ended with 2.1 percent y/y inflation. So, it 2017. But it picked up in 2018.
- It recently reached 2.9 percent y/y in July and declined to 2.7 percent y/y in August and has been declining since.
- Look at the above chart for greater clarity.
Expectation today –
- Economists are expecting a rise in the headline number, largely due to a rise in energy and food prices. Headline CPI expected at 2.1 percent y/y, while core inflation is expected at 2 percent.
Impact –
- The dollar is likely to find support, should inflation surprise to the upside by 0.2-0.3 percent. Stocks are likely to receive a boost from higher demand- driven inflation but might actually go down fearing Fed hike.
- The USD is likely to weaken sharply should core inflation disappoint by 0.2-0.3 percent. In such a case, the S&P500 likely to slump.
- However, weaker data might also be positive for the indices as it means a slower pace of hike by the U.S. Federal Reserve.
The dollar index is currently trading at 97.38


