


 FxWirePro: EUR/AUD bears maintain upper hand
  Major JPY Action Bias — Extremely Bullish Setups in NZD/JPY, AUD/JPY and CAD/JPY
  NZDJPY Extremely Bullish Above 94: Broad NZD Buying Fuels Fresh Upside – Buy Dips at 93.70 Targeting 95
  FxWirePro: NZD/USD steadies around 0.5830,retains bid tone
  FxWirePro: GBP/USD hits one-month high, scope for further upside
  FxWirePro- Major Crypto levels and bias summary
  FxWirePro- Woodies pivot (Major)
  FxWirePro- Major Pair levels and bias summary
  FxWirePro: USD/CAD falls after BoC rate hold and weak U.S. producer inflation
  FxWirePro:EUR/NZD extends fall, key support lies ahead
  FxWirePro: GBP/USD advance after softer US inflation dims Fed rate hike bets
  GBPUSD, AUDUSD & NZDUSD Turn Extremely Bullish: Strong Positive Momentum Drives Major Pair Action Bias


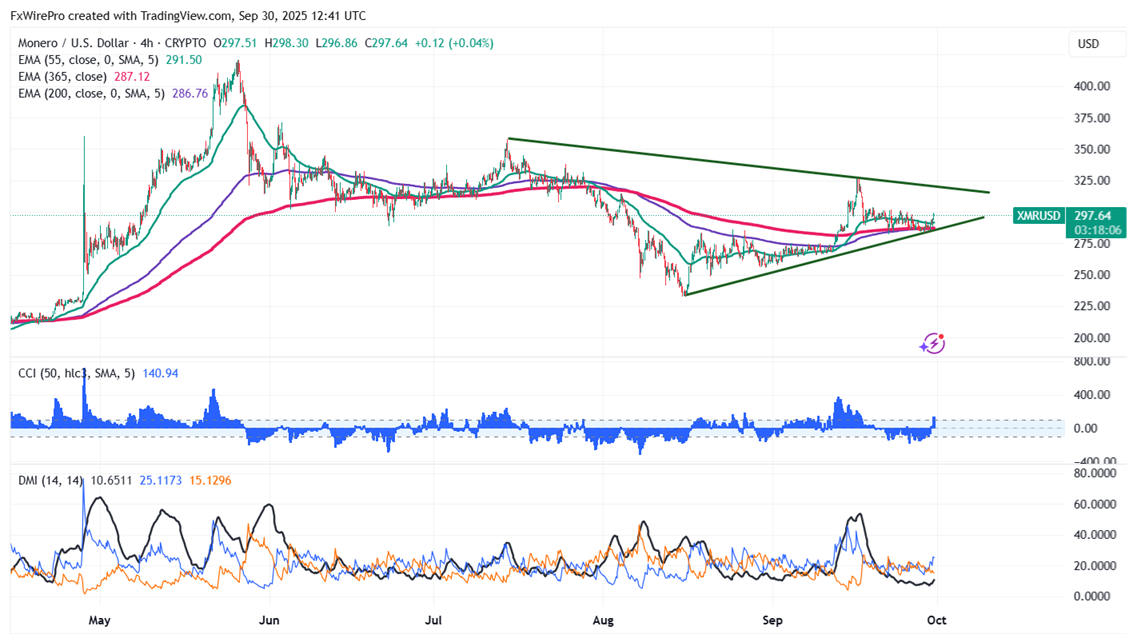
XMRUSD showed a pullback after a minor sell-off from the temporary top $326. It hits an intraday high of $299.53 and is currently trading around $297.86.
Oscillators and moving averages to forecast the trend of XMR
CMP- $297.72
EMA (4-hour chart)
55-EMA- $291.27
200-EMA- $286.65
365-EMA- $287.07. The pair trades above the short and long-term moving averages.
Previous week low- $282.40 (Sep 22nd low). Any breach below $280 will drag the pair down to $268.50/$253.
Previous week high- $302 (Sep 22nd high). Any break above $302 confirms minor bullishness, a jump to $310/321 (trend line joining $357.59 and 326.89)/$326.89 (Sep 16th high)/$357.59 (Jul 14th high).
Indicators (4-hour chart)
CCI(50)- Bullish
ADX- above 20 showing neutral bias
Investment Strategy for XMRUSD
It is good to buy on dips around $291-92 with a stop loss around $280 for target profits of $326/$357.


