


 ETH Stands Alone Bullish; BTC, SOL, XRP, BNB Neutral
  Major Pair Action Bias: Extremely Bullish Surge Powers GBPUSD & NZDUSD as Bullish Momentum Ignites
  NZDJPY Bullish Setup: Buy Dips at 94.50 as Uptrend Holds Above All Key EMAs
  FxWirePro- Major Crypto levels and bias summary
  FxWirePro: AUD/ USD eases as risk sentiment remains fragile
  FxWirePro- Major Crypto levels and bias summary
  FxWirePro: NZD/USD trades in narrow range ,outlook bullish
  AUDJPY Bullish Momentum Ignites: Buy Dips Toward 115 Target
  FxWirePro:EUR/NZD stuck In narrow ranges, focus on near term support
  Major Pair Action Bias: NZDUSD Turns Bullish While Other Majors Stay Neutral
  FxWirePro- Major Crypto levels and bias summary


Ripple connects banks and payment providers via RippleNet to provide one frictionless experience for sending and receiving money.RippleNet customers want to eliminate the need for nostro accounts and allow the banks to complete quick and inexpensive cross-border transfers. can use digital assets like XRP to source on-demand liquidity.
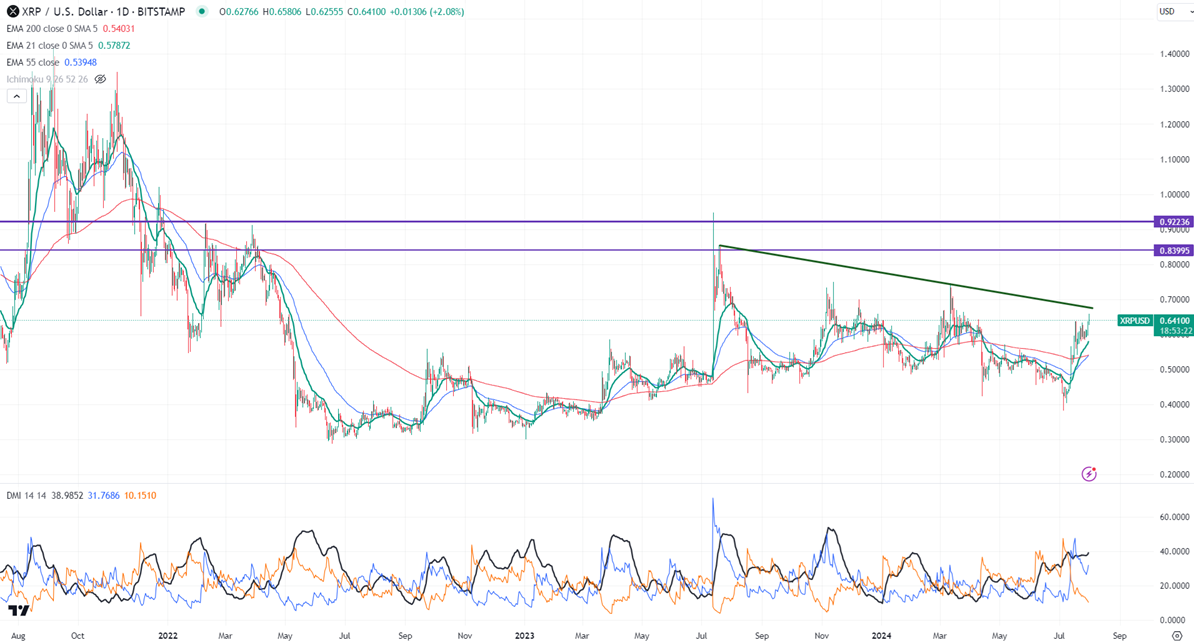
Ichimoku analysis (4- hour chart)
Tenken-Sen- $0.6250
Kijun-Sen- $0.6210
Horizontal trend line- $0.750
Downtrend channel resistance- $0.680
XRPUSD has performed well after a major sell-off.
Any daily close above $0.830 confirms further bullishness.
XRPUSD prices have surged more than 70% in the past three weeks. It hit a high of $0.6580 at the time of writing and is currently trading around $0.64
92. The pair holds above the short-term (21 and 55-day EMA) and the long-term moving average (200-day EMA).
The near-term resistance is around $0.6800, any indicative breach above will take the pair to $0.75/0.820/0.900/$1. On the lower side, immediate support is $0.5300, and any violation below targets $0.40/$0.280.
Indicators ( 4- hour chart)
Directional movement index - Bullish
It is good to buy on dips around $0.60 with SL around $0.50 for TP of $0.83/$1.


