


 FxWirePro: GBP/USD under pressure despite UK's modest economic growth
  FxWirePro- Major Pair levels and bias summary
  FxWirePro:EUR/NZD stuck In narrow ranges, focus on near term support
  Major Pair Action Bias: Extremely Bullish Surge Powers GBPUSD & NZDUSD as Bullish Momentum Ignites
  FxWirePro- Woodies pivot (Major)
  FxWirePro- Major Crypto levels and bias summary
  Gold Loses Steam After Strong U.S. Retail Sales
  GBPJPY Bullish Surge: Strong Pound Ignites Fresh Upside on Fed-BOE Policy Divergence as All EMAs Align
  FxWirePro: USD/JPY holds steady near 162 as traders await fresh catalysts
  CAD/JPY Surges on Broad-Based Canadian Dollar Buying
  NZDJPY Bullish Setup: Buy Dips at 94.50 as Uptrend Holds Above All Key EMAs
  Major Pair Action Bias: NZDUSD Turns Bullish While Other Majors Stay Neutral
  ETH Stands Alone Bullish; BTC, SOL, XRP, BNB Neutral
  NZDJPY Bullish Surge: Strong Kiwi Ignites Fresh Upside as 94 Support Holds and All EMAs Align


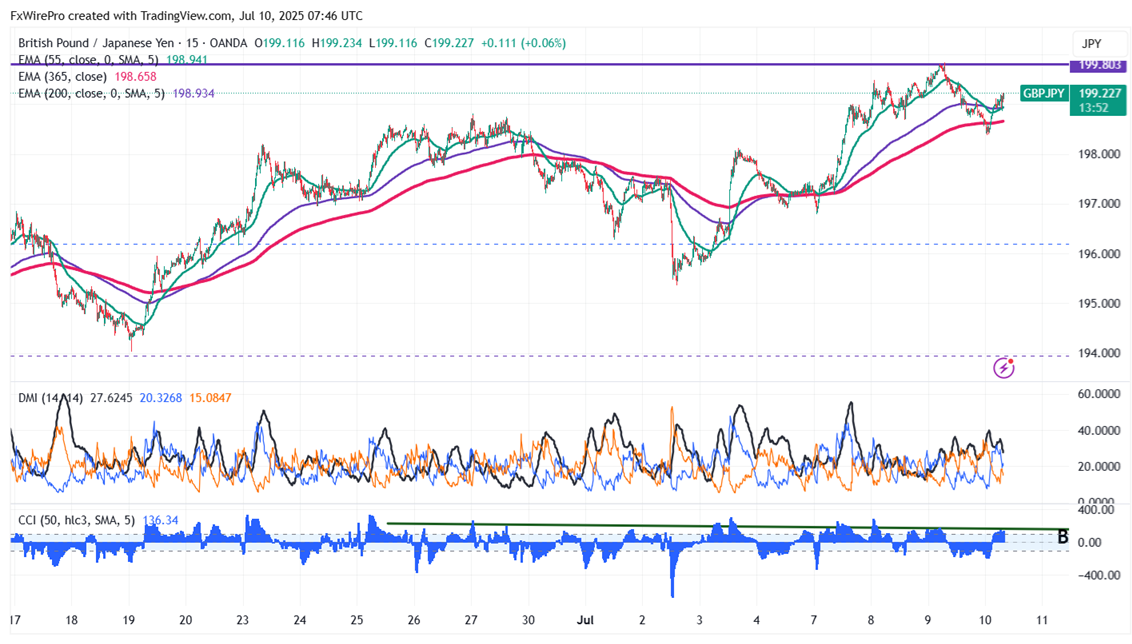
The GBP/JPY recovered above 199 as the yen underperformed. It hit an intraday high of 199.23 and is currently trading around 199.20. Intraday trend is bearish as long as the resistance at 200 holds.
The GBP/JPY pair is trading above 55 and 200 EMA (Short-term) and 365 EMA (long-term) on the 15-min chart, confirming a bullish trend. Any violation below 198.70 indicates the intraday trend is weak. A dip to 198.40/197.70/196.70/196.25/195.25/194/193.70 is possible. Immediate resistance is at 200, a breach above this level targets 202/204.
Market Indicators (15-min chart)
CCI (50)- Bullish
Directional movement index - Neutral
Trading Strategy: Sell
It Is good to sell on rallies around 199.58-60 with SL around 200.50 for a TP of 198/197.40.


