


 FxWirePro- Major Crypto levels and bias summary
  FxWirePro- Major Crypto levels and bias summary
  FxWirePro- Major Crypto levels and bias summary
  FxWirePro- Major Crypto levels and bias summary


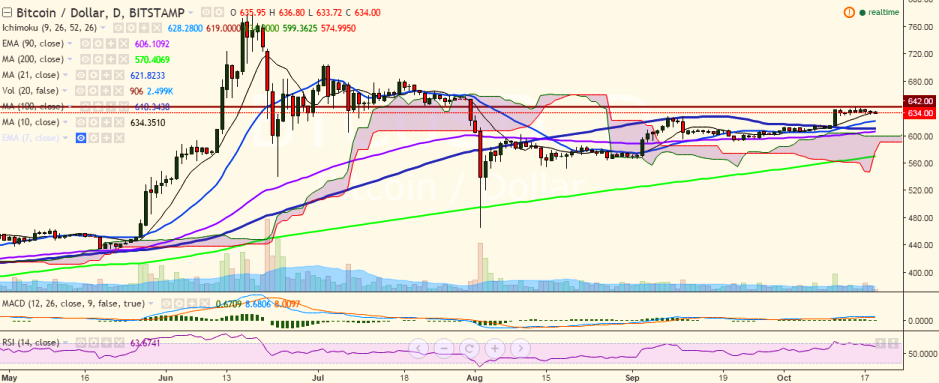
BTC/USD is trading in the red on Wednesday, continuing its gradual downtrend seen from the past few days. It is currently trading at 634 levels at the time of writing (Bitstamp).
Long-term trend: Bullish
Ichimoku analysis of daily chart:
Tenkan Sen: 627
Kijun Sen: 617.50
Trend reversal: 605.48 (90 EMA)
“The pair has taken support near 10-day MA and is currently hovering around that level. A consistent break below is likely to see a decline till 610 levels. A break below 620 levels (the trend line joining 552.30 and 567.03) would confirm bearishness in the pair”, FxWirePro said in a statement.
On the upside, the pair will run into resistance at 642 levels (October 15 high) and a break above would target 648.12 levels (161.8% retracement of 642 and 632.10)/684.19 (July 17 high).
On the flipside, support is seen at near 632.25 (10-day MA) and a close below would target 610.49 (100-day MA)/ 605.48 (90 EMA).

- News

- Economy

- Central Banks
- Investing
- Research
- Roundups
- Digital Currency
- Insights
- Technical Analysis
- Technology
- Business
- Law
- Health
- Nature
- Fintech
- Science
- Topic
- Opinions
- ©Econometrics LLC . All Rights Reserved.
BTC/USD takes support near 10-DMA, bullishness only above 642
Wednesday, October 19, 2016 7:27 AM UTC
Editor's Picks


- Market Data
Most Popular


