


 FxWirePro- Major Crypto levels and bias summary
  Ethereum Cracks Under $1,700: Sell the Rally Near $1,750 as Bears Eye $1,380–$1,200
  FxWirePro- Major Crypto levels and bias summary


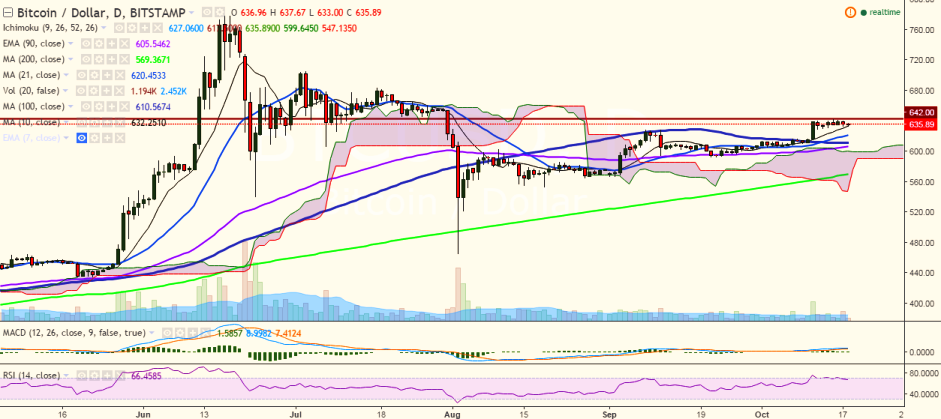
BTC/USD continues to trade in a narrow range, holding its strength above the 630.00 level. It is currently trading at 635.83 levels at the time of writing (Bitstamp).
Long-term trend: Bullish
Short-term trend: Bullish
Ichimoku analysis of daily chart:
Tenkan Sen: 626
Kijun Sen: 617.25
Trend reversal: 604.86 (90 EMA)
On the upside, major resistance is seen at 642 levels (October 15 high) and a break above would see the pair testing 648.12 levels (161.8% retracement of 642 and 632.10)/684.19 (July 17 high).
On the downside, the pair is likely to find support near 630.09 (10-day MA) and a close below would target 610.69 (100-day MA)/ 604.86 (90 EMA).

- News

- Economy

- Central Banks
- Investing
- Research
- Roundups
- Digital Currency
- Insights
- Technical Analysis
- Technology
- Business
- Law
- Health
- Nature
- Fintech
- Science
- Topic
- Opinions
- ©Econometrics LLC . All Rights Reserved.
FxWirePro: BTC/USD trades rangebound, good to go long above 642
Tuesday, October 18, 2016 9:16 AM UTC
Editor's Picks


- Market Data
Most Popular


