


 EUR/JPY Bulls Charge: Eyeing 186.00 as Euro Strength Intensifies
  FxWirePro- Major European Indices
  Bitcoin Battles Volatility: Institutional Support Eyes USD 64,000 Floor Amid Geopolitical Tensions
  FxWirePro: EUR/ NZD steadies around 2.0150, retains bid tone
  FxWirePro- Major Crypto levels and bias summary
  Ethereum Retreats Toward USD 2,000: Technicals Signal Caution as ETH Mimics Bitcoin’s Pullback
  Ethereum in Consolidation: ETH Trapped in Narrow Range as Bulls Await the USD 2,000 "Buy the Dip" Opportunity
  Euro Retreats as Geopolitical Tensions Surge: EURUSD Eyes 1.1400 Floor Amid Safe-Haven Demand
  FxWirePro- Major Crypto levels and bias summary
  FxWirePro: GBP/USD outlook weaker on renewed downside pressure


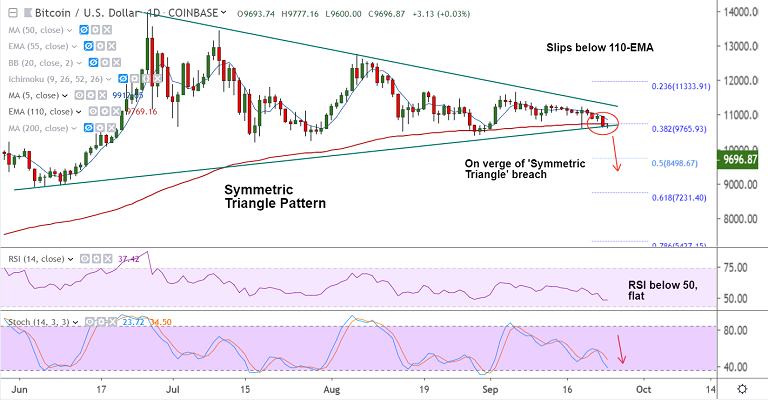
BTC/USD chart - Trading View
Exchange - Coinbase
Support: 9338 (21W EMA); Resistance: 5-DMA (9912)
Technical Analysis: Bias Bearish
BTC/USD slips below 110-EMA, tests triangle base support at 9630, bias is bearish.
RSI is well below 50 and Stochs are sharply lower. Volatility is rising on the daily charts.
MACD shows bearish crossover and ADX is rising in support of the current downtrend.
The pair is currently holding support at 9600 mark. Break below will see resumption of weakness.
Major trend is flat as shown in GMMA indicators. Parabolic SAR shows further downside.
'Symmetric Triangle' breach will plummet prices. Next major support lies at 9338 (21W EMA) ahead of 8498 (50% Fib).
On the flipside, 55-EMA is strong resistance at 10229, breakout negates near-term bearish bias.


