


 FxWirePro- Major Crypto levels and bias summary
  FxWirePro: GBP/NZD remains buoyant, looks to extend gains
  FxWirePro- Major Pair levels and bias summary
  NZDJPY Bears Take Control: New Zealand Dollar Retreats as 92 Resistance Holds Firm
  Bitcoin’s High-Stakes Volatility: BTCUSD Navigates Geopolitical Storms
  Ethereum Rises on Geopolitical De-escalation: Pezeshkian’s Peace Signal Ignites Bullish Momentum
  FxWirePro- Major European Indices
  Ethereum in Consolidation: ETH Trapped in Narrow Range as Bulls Await the USD 2,000 "Buy the Dip" Opportunity
  FxWirePro: GBP/USD outlook weaker on renewed downside pressure
  Bitcoin Battles Volatility: Institutional Support Eyes USD 64,000 Floor Amid Geopolitical Tensions
  FxWirePro: EUR/ NZD steadies around 2.0150, retains bid tone


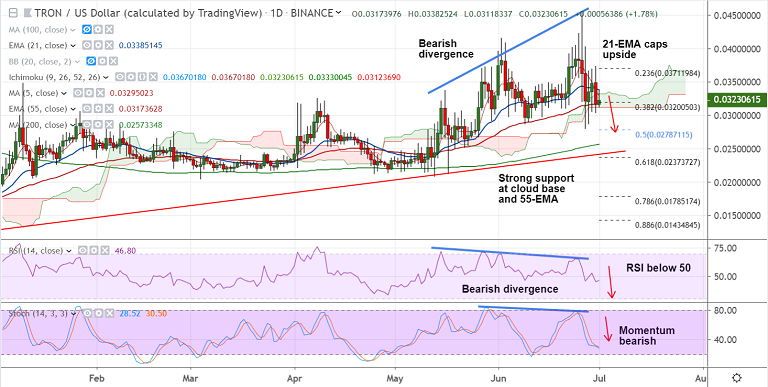
TRX/USD chart - Trading View
Exchange - Binance
Support: 0.0312 (Cloud base); Resistance: 0.0338 (21-EMA)
Technical Analysis: Bias Bearish
TRON extends gradual grind lower along 5-DMA which is biased sharply lower.
Upside in the pair capped at 21-EMA (0.0338), the pair edges lower from session highs at 0.0338 and was trading at 0.0322 at 07:35 GMT.
Signs of weakness emerge on the intraday charts, technical indicators are turning bearish.
RSI is below 50 and biased lower, Stochs show momentum is with the bears. A bearish divergence on RSI and Stochs adds to the downside bias.
Bearish MACD line crossover on signal line and bearish 5-DMA crossover on 20-DMA support weakness.
Break below cloud eyes next immediate support at 110-EMA (0.0292). Further weakness to see test of 200-DMA (0.0257).
For details on FxWirePro's Currency Strength Index, visit http://www.fxwirepro.com/currencyindex.


