


- News

- Economy

- Central Banks
- Investing
- Research
- Roundups
- Digital Currency
- Insights
- Technical Analysis
- Technology
- Business
- Law
- Health
- Nature
- Fintech
- Science
- Topic
- Opinions
- ©Econometrics LLC . All Rights Reserved.
Apr 03, 2020 09:58 am UTC| Technicals Research & Analysis
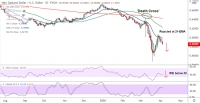
NZD/USD chart - Trading View NZD/USD was trading 1.06% lower on the day at 0.5850 at around 09:40 GMT. The pair has ignored Doji formation in the previous days candle and has resumed downside. US Dollar continues...
FxWirePro: Sterling Seems Vulnerable Again To Macroeconomic Factors – Reshuffle Short GBP Trades
Apr 03, 2020 08:35 am UTC| Research & Analysis
In the UK, the government has announced changes to its business emergency loan schemes, including the removal or reduction of personal guarantees for small business loans and government loans extended for mid-sized firms...
Apr 03, 2020 08:09 am UTC| Research & Analysis Digital Currency Insights & Views
Of late, weve seen many new inventions within the gamut of FinTech, just likestate-backedstablecoin, PBoC Deputy chiefdivulgedthe Outlines of DCEP(Digital Currency Electronic Payment,their native...
FxWirePro: AUD/JPY finds stiff resistance at 65.70, good to go short on upticks
Apr 03, 2020 07:45 am UTC| Technicals Research & Analysis
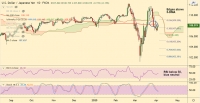
AUD/JPY chart - Trading View AUD/JPY was trading largely unchanged at 65.35 at around 07:35 GMT, slipping lower from session highs at 65.61. The pair was capped at 5-DMA resistance at 65.64, scope for downside...
Apr 03, 2020 05:35 am UTC| Technicals Research & Analysis
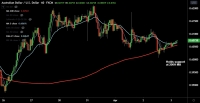
AUD/USD chart - Trading View AUD/USD was trading 0.22% higher on the day at 0.6071 at around 05:00 GMT, bias neutral. The Aussie dollar fails to benefit from above-forecast Aussie retail sales data and a rebound in...
Apr 03, 2020 03:57 am UTC| Technicals Research & Analysis
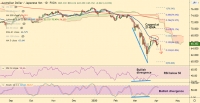
USD/JPY chart - Trading View USD/JPY has erased early gains and was trading rangebound around 108 handle, down from session highs at 108.19. Lingering concerns over the Japanese outbreak of COVID-19 would potentially...
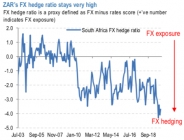
FxWirePro: Heads-Up on ZAR Valuations & Hedging Possibilities
Apr 02, 2020 13:10 pm UTC| Research & Analysis Insights & Views
There are some technical positives for ZAR, which under normal circumstances may be sufficient to stabilize the currency, but amid end-of cycle concerns are probably not a good guide. For completeness, we review valuation...


South Africa Eyes ECB Repo Lines as Inflation Eases and Rate Cuts Loom

Russian Stocks End Mixed as MOEX Index Closes Flat Amid Commodity Strength

China Extends Gold Buying Streak as Reserves Surge Despite Volatile Prices

Trump Lifts 25% Tariff on Indian Goods in Strategic U.S.–India Trade and Energy Deal

Trump Signs Executive Order Threatening 25% Tariffs on Countries Trading With Iran


New York Legalizes Medical Aid in Dying for Terminally Ill Patients

Trump Says “Very Good Talks” Underway on Russia-Ukraine War as Peace Efforts Continue

China Warns US Arms Sales to Taiwan Could Disrupt Trump’s Planned Visit

Trump Allows Commercial Fishing in Protected New England Waters

SpaceX Prioritizes Moon Mission Before Mars as Starship Development Accelerates

NASA and SpaceX Target Crew-11 Undocking From ISS Amid Medical Concern

Neuralink Plans High-Volume Brain Implant Production and Fully Automated Surgery by 2026

Jared Isaacman Confirmed as NASA Administrator, Becomes 15th Leader of U.S. Space Agency
Senate Sets December 8 Vote on Trump’s NASA Nominee Jared Isaacman
Nvidia CEO Jensen Huang Says AI Investment Boom Is Just Beginning as NVDA Shares Surge

Amazon Stock Rebounds After Earnings as $200B Capex Plan Sparks AI Spending Debate

Global PC Makers Eye Chinese Memory Chip Suppliers Amid Ongoing Supply Crunch

OpenAI Expands Enterprise AI Strategy With Major Hiring Push Ahead of New Business Offering

SoftBank Shares Slide After Arm Earnings Miss Fuels Tech Stock Sell-Off


- Market Data


