


 China's Refining Industry Faces Major Shakeup Amid Challenges
  FxWirePro- Major Crypto levels and bias summary
  JPMorgan Cuts Gold Price Forecast, Sees Bullion Reaching $4,500 by End of 2026
  ETHUSD Bullish Momentum: Follows BTC Above All EMAs, Buy Dips Near $1750 Targeting $2300
  Bernstein Names IAG, Ryanair as Top European Airline Stocks Ahead of Earnings
  Lithium Market Poised for Recovery Amid Supply Cuts and Rising Demand
  Bank of America Posts Strong Q4 2024 Results, Shares Rise
  Indonesia Surprises Markets with Interest Rate Cut Amid Currency Pressure


We run you through the descriptive analysis of crypto-space in this write-up, the aggregate market cap of entire cryptocurrency space has now been at US$120 billion. The mid of Q4’2018 has been a vicious drop in all cryptocurrencies, but with the bitcoin dominance, which is perceived as a pioneer in the industry that could be used as a market wide confidence index, held steadily at around 50% during that time.
We reckon that, any near time in future, with SEC’s meticulous regulation in 2019, bitcoin unlikely to fetch return to >80% market cap dominance as the ICOs for other cryptos are persistently swollen in the ecosphere. While the current XRP price momentum in its proper perspective, we witness over 6% drop in USD value and a 0.5% loss in BTC value.
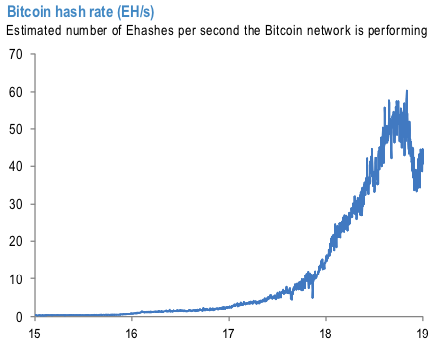
Following the declines in cryptocurrency values in November and early December, we noted the decline in Bitcoin mining activity too as profitability also collapsed (F&L, Dec 14), following a significant increase during 2018 boosted by improvements in technology. After a modest recovery in prices in the second half of December, mining activity recovered somewhat (refer 1stchart).
The intrinsic value of such mined coin would be challenging, that affects market price estimation, which in turn, affects market capitalization also. That is why we referred to J P Morgan’s analytic piece who followed a methodology adopted by Hayes (2018), which first estimates the daily cost of production as a function of the computational power employed, cost of electricity, and energy efficiency of hardware. It then divides the daily cost of production by the number of bitcoins that can be produced daily to get a marginal cost of production per Bitcoin.
In order to estimate this marginal cost of production for Bitcoin at an aggregate level, we use daily data on market price, hash rate and difficulty from bitinfocharts.com, and use the assumptions employed by Hayes (2018) on efficiency of mining hardware and electricity costs ($0.135 per kWh) up to February 2018 (latest data provided in the appendix of the paper).
The actual market price and estimate of the intrinsic value of Bitcoin are shown in the 2ndchart, and the ratio of price to intrinsic value is shown in the 3rdchart. Similar to the results of Hayes (2018), we find that the sharp spike in Bitcoin prices during 4Q’17 saw a significant overshoot of the market price relative to intrinsic value based on the cost of production approach, which then corrected as the rise in prices saw an increase in mining activity and as the market price subsequently declined. Indeed, the market price peaked at just below $20,000 in mid-December 2017, while our intrinsic value estimate peaked at around $9,100 in early March 2018 by which time the market price had converged to this level. Courtesy: JPM
Currency Strength Index: FxWirePro's hourly BTC spot index is flashing -14 (which is mildly bearish), while hourly USD spot index was at -43 (bearish) while articulating (at 12:45 GMT).
For more details on the index, please refer below weblink: http://www.fxwirepro.com/currencyindex


