


 FxWirePro- Major Crypto levels and bias summary
  FxWirePro- Major Crypto levels and bias summary


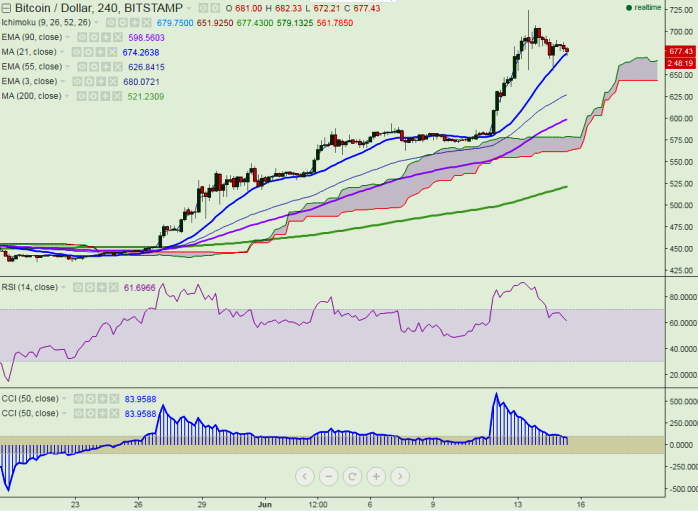
BTC/USD is trading in a narrow range between $778 and $723 for the past two trading session. It is currently trading at $757.45 (Bitstamp), at the time of writing.
Ichimoku analysis (4 Hour chart):
Tenkan-Sen level: $757
Kijun-Sen level: $733
Trend reversal level - (90 day 4H EMA)-$665
Long-term trend remains bullish and the pair faces major resistance is around $778 (Jun 17 high) and any break above $776 will take the pair till $830 (127.2% retracement of 9686 and $153)/$886. On the flipside, short-term support is likely to be found at $733 (4 H Kijun-Sen) and any violation below will drag the pair till $706/$665 (4h 90 EMA).
“BTC/USD trades flat and is good to buy at dips around $700”, said FxWirePro in a statement.

- News

- Economy

- Central Banks
- Investing
- Research
- Roundups
- Digital Currency
- Insights
- Technical Analysis
- Technology
- Business
- Law
- Health
- Nature
- Fintech
- Science
- Topic
- Opinions
- ©Econometrics LLC . All Rights Reserved.
BTC/USD consolidates in narrow range, good to buy at dips
Monday, June 20, 2016 4:56 AM UTC
Editor's Picks


- Market Data
Most Popular


