


 FxWirePro- Major Crypto levels and bias summary
  BTC’s Bear Bounce: Sell the Rally Near $66K as Bears Target $59K–$52K Breakdown
  FxWirePro- Major Crypto levels and bias summary
  FxWirePro- Major Crypto levels and bias summary
  Ethereum Cracks Under $1,700: Sell the Rally Near $1,750 as Bears Eye $1,380–$1,200


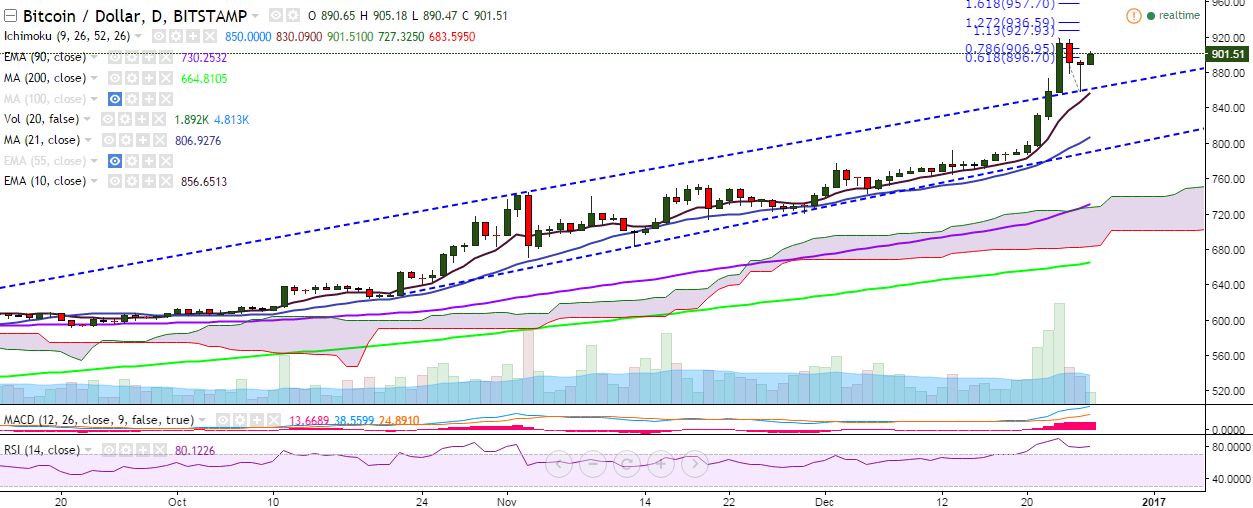
BTC/USD declined to 859 levels after hitting a high of 920 levels on December 23. The pair is now once trying to break above the 900 mark and is trading at 901.69 levels at the time of writing (Bitstamp).
Long-term trend: Bullish
Short-term trend: Bullish
Ichimoku analysis of daily chart:
Tenkan Sen: 850
Kijun Sen: 823.50
Trend reversal: 726.40 (90 EMA)
On the upside, a consistent break above the 900 level would see the pair testing 920 (December 23 high). Further strength would target 957 (161.8% retracement of 920 and 859)/981.
On the reverse side, the pair has taken support at the trend line joining 628.99 and 745.19 (859 levels). A break below this level would drag it to 846.68 (10-EMA)/824.62 (38.2% retracement of 670.32 and 920).

- News

- Economy

- Central Banks
- Investing
- Research
- Roundups
- Digital Currency
- Insights
- Technical Analysis
- Technology
- Business
- Law
- Health
- Nature
- Fintech
- Science
- Topic
- Opinions
- ©Econometrics LLC . All Rights Reserved.
BTC/USD hovers around 900, break above 920 targets 957
Monday, December 26, 2016 8:28 AM UTC
Editor's Picks


- Market Data
Most Popular


