


 FxWirePro- Major Crypto levels and bias summary
  FxWirePro- Major Crypto levels and bias summary
  BTC’s Bear Bounce: Sell the Rally Near $66K as Bears Target $59K–$52K Breakdown
  Ethereum Cracks Under $1,700: Sell the Rally Near $1,750 as Bears Eye $1,380–$1,200


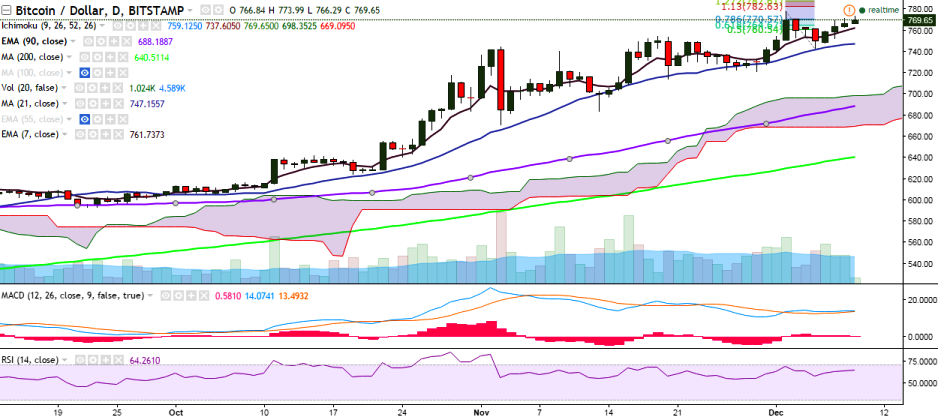
BTC/USD is gradually inching closer to previous high of 778.07 levels and is currently trading at 770 levels at the time of writing (Bitstamp).
Long-term trend: Bullish
Short-term trend: Bullish
Ichimoku analysis of daily chart:
Tenkan Sen: 752.53
Kijun Sen: 730.65
Trend reversal: 686.35 (90 EMA)
The pair faces resistance at 778.07 (December 02 high) and a consistent break above would see it testing 799.74 levels (161.8% retracement of778.07 and 743)/ 819 (113% retracement of 778.85 and 465.28).
On the down side, the pair has taken support near 759.09 (7-EMA) and a break below would drag it to 743 (December 05 low)/714 (November 20 low).

- News

- Economy

- Central Banks
- Investing
- Research
- Roundups
- Digital Currency
- Insights
- Technical Analysis
- Technology
- Business
- Law
- Health
- Nature
- Fintech
- Science
- Topic
- Opinions
- ©Econometrics LLC . All Rights Reserved.
BTC/USD inches closer to 778, break above targets 800
Friday, December 9, 2016 10:45 AM UTC
Editor's Picks


- Market Data
Most Popular


