


 FxWirePro- Major Crypto levels and bias summary
  FxWirePro- Major Crypto levels and bias summary
  BTC’s Bear Bounce: Sell the Rally Near $66K as Bears Target $59K–$52K Breakdown


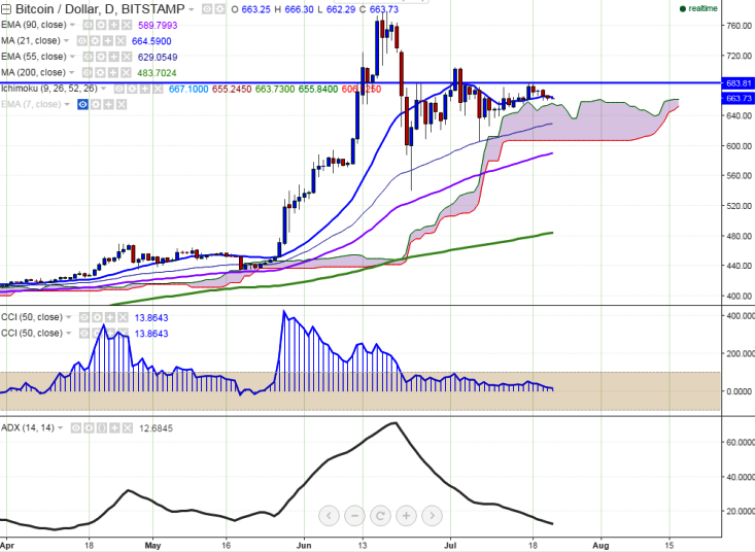
BTC/USD is trading in a narrow range on Friday, between 662 and 666 levels. The pair managed to break above 21 MA recently but seems to be failing to sustain its strength. It is currently trading at 665.12 levels at the time of writing (Bitstamp).
Ichimoku analysis of daily chart:
Tenkan Sen: 667.10
Kijun Sen: 655.24
Trend Reversal: 588.13 (90 EMA)
“BTC/USD has formed almost a double top and declined from that level. The pair should close above 21 MA for further upside till 685”, FxWirePro said in a statement.
On the upside, resistance is seen at 684.19 levels (July 17 high) and a break above will target 705 levels (July 3 high)/732 (127.2% retracement of 704.99 and 605.50). On the flipside, support is seen at 655 (daily Kijun Sen) and any violation below will drag the pair till $627 (55 day EMA)/$605 (Jul 7 low).

- News

- Economy

- Central Banks
- Investing
- Research
- Roundups
- Digital Currency
- Insights
- Technical Analysis
- Technology
- Business
- Law
- Health
- Nature
- Fintech
- Science
- Topic
- Opinions
- ©Econometrics LLC . All Rights Reserved.
BTC/USD struggles to break above 21 MA, break above confirms bullishness
Friday, July 22, 2016 7:38 AM UTC
Editor's Picks


- Market Data
Most Popular


