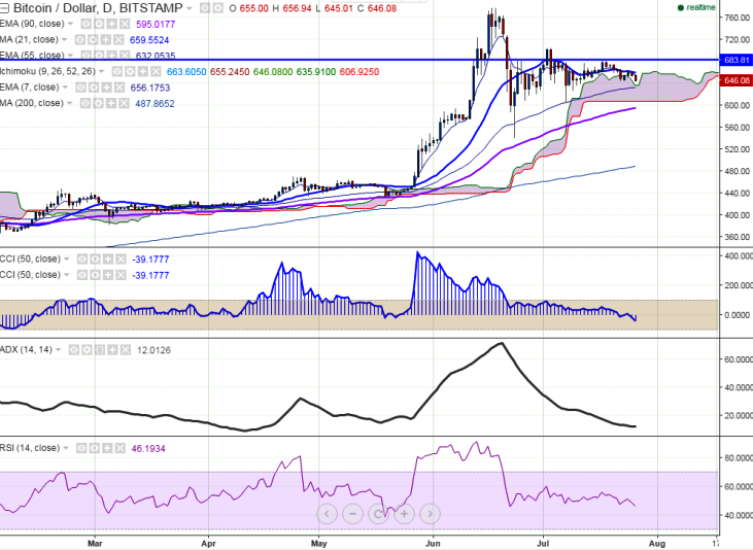
BTC/USD is seen trading well below in red on Tuesday. The pair has drastically after making a high of $662 levels (BITSTAMP) yesterday. It is currently trading at $646 at the time of writing. Ichimoku analysis of daily c…
BTC/USD is seen trading well below in red on Tuesday. The pair has drastically after making a high of $662 levels (BITSTAMP) yesterday. It is currently trading at $646 at the time of writing.
Ichimoku analysis of daily chart shows:
Tenkan-Sen level: $664.59
Kijun-Sen level: $655.24
Trend reversal level - (90 EMA)-$593.84
The long-term trend remains to be bullish. BTC/USD trades well below 21 days MA ($660). So a decline till $630/$605 is possible.
Major resistance is around $655 (daily Kijun-Sen) and any break above targets $665/$685 (Jun25th high)/ $705 (Jul 2nd high). Short term support is seen at $645 (Jul 22nd low) and any violation below will drag the pair till $630 (55 days EMA)/$605 (Jul 7th low).
A separate 16-month sample ending in September 2026 found more than 87% of payments between $0.0001 and $0.10, but its window extends beyond the transaction tally’s cutoff.