


 Gold Pulls Back After Hitting $4,180 as Geopolitical Risk Sends Crude Higher
  Bernstein Names IAG, Ryanair as Top European Airline Stocks Ahead of Earnings
  Morgan Stanley Names Marks & Spencer Top European Retail Pick, Sees Strong Upside
  Citi Raises TSMC Price Target as AI Chip Demand Strengthens Growth Outlook
  JPMorgan Cuts Gold Price Forecast, Sees Bullion Reaching $4,500 by End of 2026
  Goldman Sachs Flags 3 Key Risks Ahead of Europe’s Earnings Season


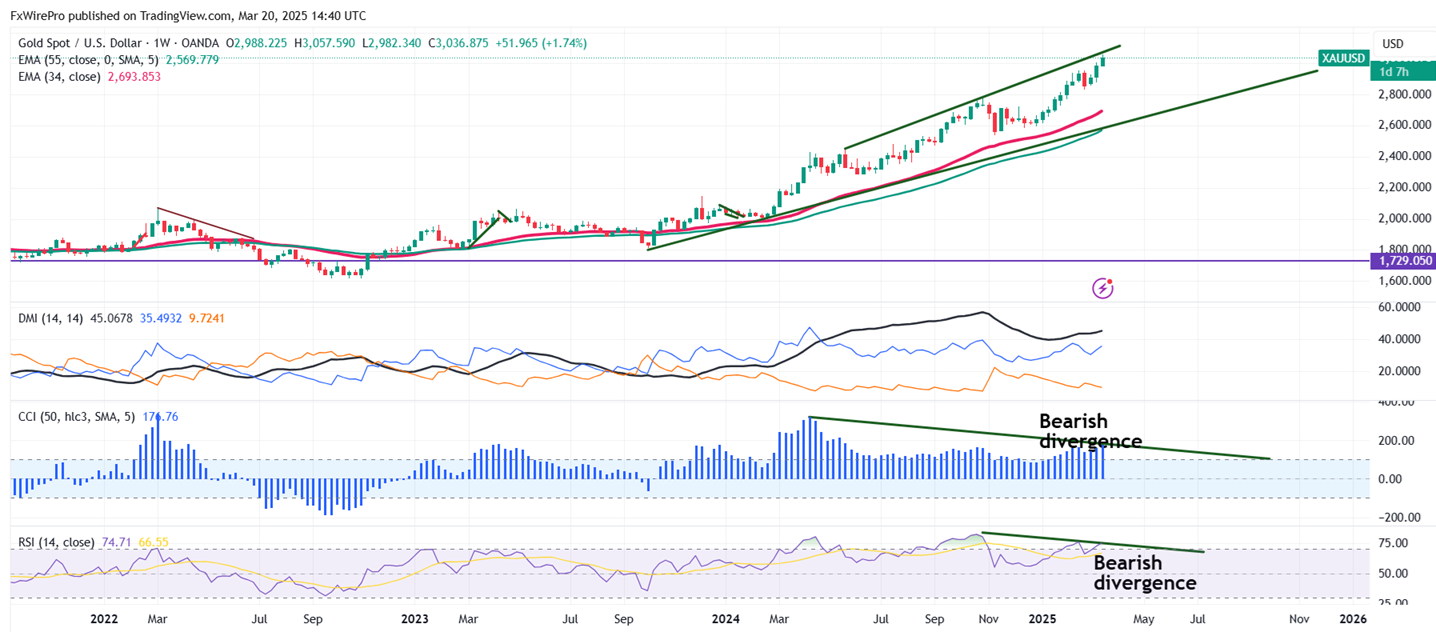
Bearish divergence (RSI and CCI (50)- Daily and weekly chart
Gold hits an all-time high at $3057 and surged more than 15% this year as geopolitical tension increases demand for safe-haven assets. It is currently trading at around $3035.
Rate Pause Expectations Rise
According to the CME Fed Watch tool, the chances of a rate pause in the May 19th, 2025 meeting have increased to 85% from 65.20% a week ago.
Technical Analysis: Key Levels and Trading Strategy
Gold prices are holding above short-term moving averages of 34 EMA and 55 EMA and abovethe long-term moving averages (200 EMA) in the weekly chart. Immediate support is at $3020 and a break below this level will drag the yellow metal to $2985/$2956/$2920/$2900/$2880. The near-term resistance is at $3080 (trend line joining $2450 and $2790) with potential price targets at $3100.
Indicators -
RSI (14)- 72.49 (oversold)
It is good to sell on rallies around $3048-50 with a stop-loss at $3080 for a target price of $2835.


