


 Goldman AM Sees Strong Buyout Opportunities in Japan, South Korea and Australia
  JPMorgan Cuts Gold Price Forecast, Sees Bullion Reaching $4,500 by End of 2026
  Bank of America Upgrades T-Mobile to Buy, Says LEO Satellite Fears Are Overdone
  Citi Raises TSMC Price Target as AI Chip Demand Strengthens Growth Outlook
  Gold Surges Past $4150 on Dovish Fed Signals and Weak Jobs Data; Bullish Outlook Prevails


From October 29 to November 5, 2025, U.S. spot Bitcoin ETFs suffered a severe six-day outflow streak, hemorrhaging almost $1.9 billion—the greatest redemption wave ever recorded—with a peak single-day bleed of $577 million on November 4. Led by BlackRock's IBIT ($112.4 million), Fidelity's FBTC ($61.6 million), and ARK's ARKB ($60.4 million), the tide changed on November 6 with $240 million in inflows, therefore breaking the streak but leaving the week (November 3–7) down approximately $799 million net. Though reversing, cumulative inflows since launch are strong at $60.5 billion, with total ETF assets between $135 and $140 billion—representing around 5.42% of Bitcoin's market capitalization.
Whale behavior paints a mixed image as Bitcoin's drop below $100,000 to a four-month low of $98,900, now ranging at $101-103K (down 11% since the October 1 government shutdown). Early November saw top-tier whales (10,000 BTC) add 10,788 BTC, yet the important 10-1K BTC cohort that propelled the previous surge dropped 5,760 BTC, whereas Binance reserves increased and Coinbase Premium remained negative—showing selling pressure. Having accumulated positions since March, one courageous whale cashed $12.99 million in shorting gains on November 7. Still, on-chain data show no total capitulation: Fear & Greed at 21, but MVRV and STH RPR suggest a likely local bottom at $98K with seller exhaustion prepared for a possible comeback.
Technical Analysis: Key Levels to Watch for BTC/USD
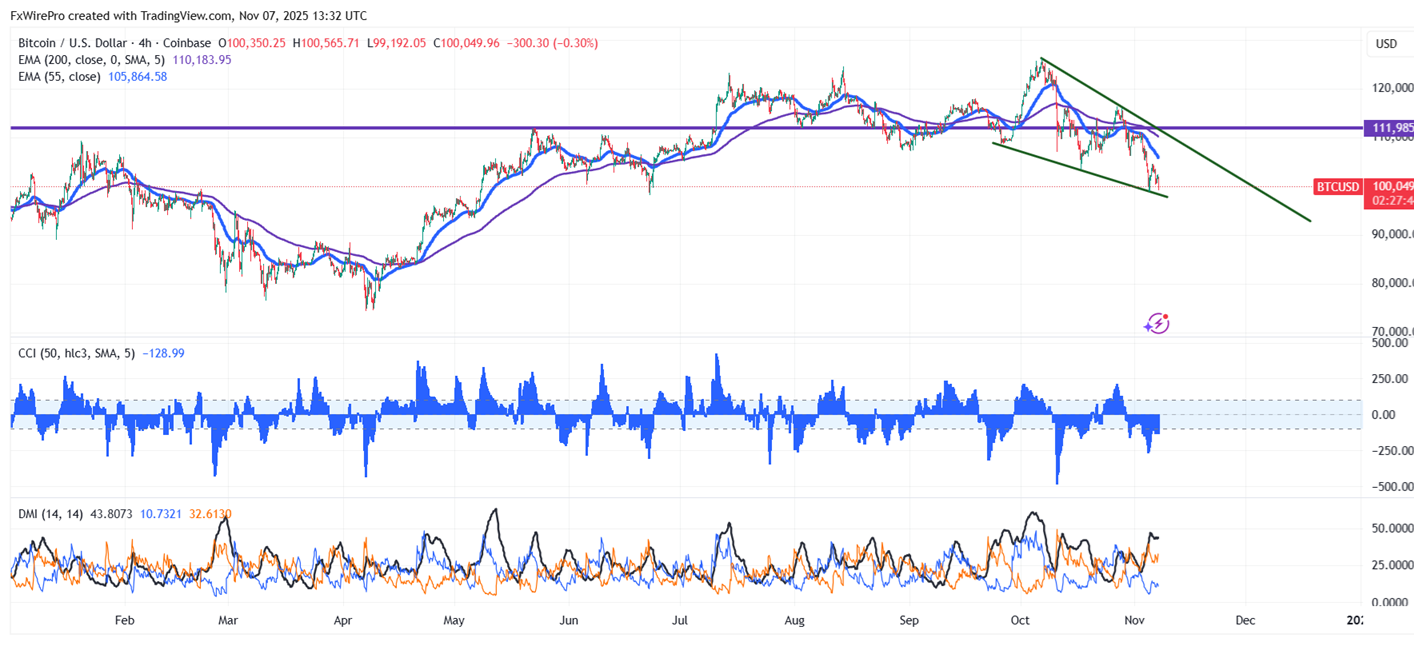
BTC/USD breaks psychological support $100000 on weak institutional demand. The pair hits an intraday low of $99622 and is currently trading around $99672.
It trades below short-term (34-EMA and 55-EMA) and long-term (200 and 365-EMA) moving averages on the 4-hour chart. Minor support is around $98500; breaking below this would drag the pair down to $95500/$92800/$90000. Immediate resistance is around $105000 indicates that closing above this level could lead to targets $108000/$115000/$120000.
Investment Strategy: Opportunities for Traders
Indicators (4-hour chart).
CCI(50)- Bearish
Directional movement index - Neutral
It is good to buy on dips around $95800-900 with a stop-loss set at $92000 for a TP of $108000/$115000.


