


 FxWirePro- Major Crypto levels and bias summary
  US Inflation Expected to Ease in June, but Fed Rate Hike Risks Persist Amid Middle East Tensions
  FxWirePro- Major Crypto levels and bias summary
  FxWirePro- Major Crypto levels and bias summary
  Citi Raises TSMC Price Target as AI Chip Demand Strengthens Growth Outlook
  UBS Boosts China Tech Bets, Adds Kuaishou and Meituan to Focus List
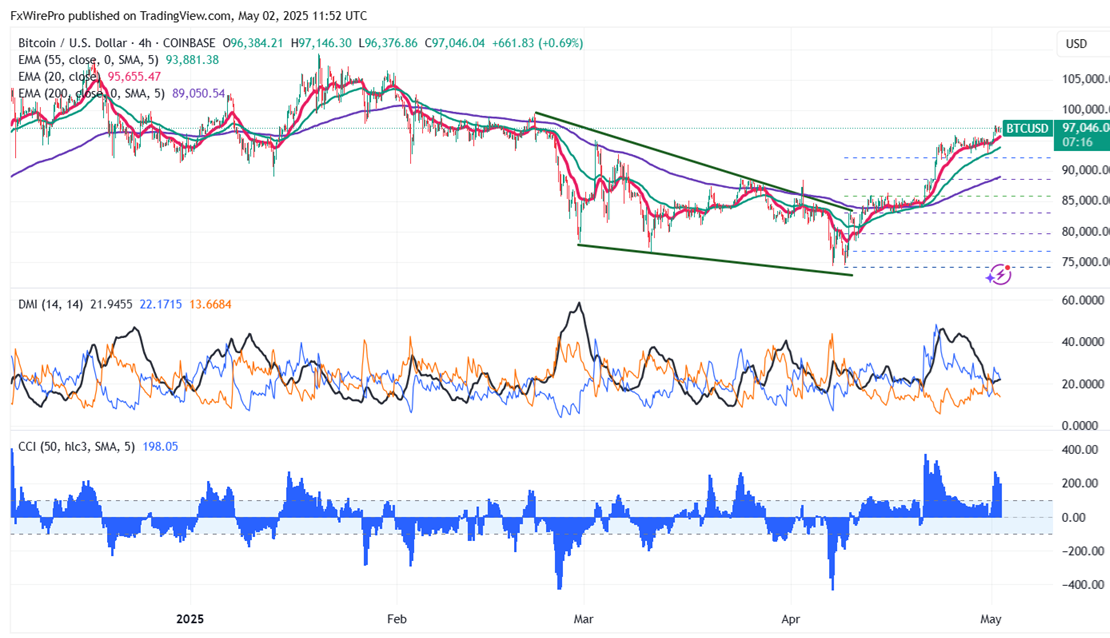
  BTCUSD Bullish Breakout: Clears 800-EMA After Consolidation, Buy Dips Toward $74,900


Supply Scarcity Fuels Bitcoin's Bullish Momentum
Bitcoin exchange inflows have fallen to multi-year lows, representing a steep drop in sell-side pressure and accumulation building. Individual wallet addresses exchange-only sending frequency has fallen to an all-time low since 2017, and the exchange whale ratio has fallen, indicating decreasing whale selling and rising retail involvement. Furthermore, the amount of Bitcoin in exchanges is at a seven-year low, and large-scale outflows were induced by institutional purchases. Publicly listed entities like MicroStrategy, as well as Hong Kong and Japanese institutions, have recorded significant increases in their Bitcoin holdings.
Those conditions suggest that there could be a scarcity of supply, and that is in favor of a bullish outlook for Bitcoin. The Bitcoin price has gone above $95,000, and market analysts are looking for $100,000 as the tight supply is one of the reasons for that. Strong institutional demand is reflected in huge inflows into spot Bitcoin ETFs, and earlier, miner production costs reaching levels close to current prices have indicated bull runs. Small weekend exchange inflows indicate there is some lingering volatility, but overall, the trend is indicating weakening selling pressure and growing accumulation
Technical Analysis: Key Levels to Watch for BTC/USD
BTC/USD currently trades above both short-term (34-EMA and 55-EMA) and below long-term (200-EMA) moving averages on the daily chart. Minor support is around $92500; breaking below this would drag the pair down to $89000/$85900/$83000. Immediate resistance is around $100000 any breach above confirms intraday bullishness, a jump to $110000. A secondary barrier at $110,000 indicates that closing above this level could lead to targets at $111,292, $115,000, or even $135,000.
Investment Strategy: Opportunities for Traders
Indicators (4-hour chart).
CCI(500- Bullish
Directional movement index - Neutral
It is good to buy on dips around $95000, with a stop-loss set at $90000 for a TP of $110000.


