


 Goldman Sachs Flags 3 Key Risks Ahead of Europe’s Earnings Season
  Goldman AM Sees Strong Buyout Opportunities in Japan, South Korea and Australia
  Gold Pulls Back After Hitting $4,180 as Geopolitical Risk Sends Crude Higher
  Crypto Major Pair Action Bias: ETHUSD Bullish as BTCUSD, SOLUSD & XRPUSD Stay Neutral
  US Inflation Expected to Ease in June, but Fed Rate Hike Risks Persist Amid Middle East Tensions
  FxWirePro- Major Crypto levels and bias summary


Bitcoin's on-chain metrics signal a robust bullish outlook despite recent price consolidation, driven by unprecedented network security and institutional accumulation. The network hash rate has surged 104% year-over-year to 1.014 billion terahashes per second, with mining difficulty reaching all-time highs in September 2025, reinforcing Bitcoin's resilience against attacks and attracting institutional interest. Additionally, nearly 19,000 addresses now hold at least 100 BTC, a record high, while corporate treasuries, led by BlackRock’s IBIT ETF, hold 951,000 BTC worth $100 billion, reducing circulating supply and establishing a strong price floor.
Market structure further supports this bullish case, with derivatives markets showing balanced dynamics and whale accumulation during price dips around the $108,000 support level. Bitcoin options open interest hit a record $54.6 billion, with a bullish bias toward calls, and the futures basis remains below 10%, indicating steady demand without speculative excess. On-chain liquidity is constructive, with the NVT ratio below 50 suggesting a healthy correction, while stable miner reserves at 1.805 million BTC and easing selling pressure reflect a market poised for continued strength, underpinned by solid fundamentals and institutional confidence.
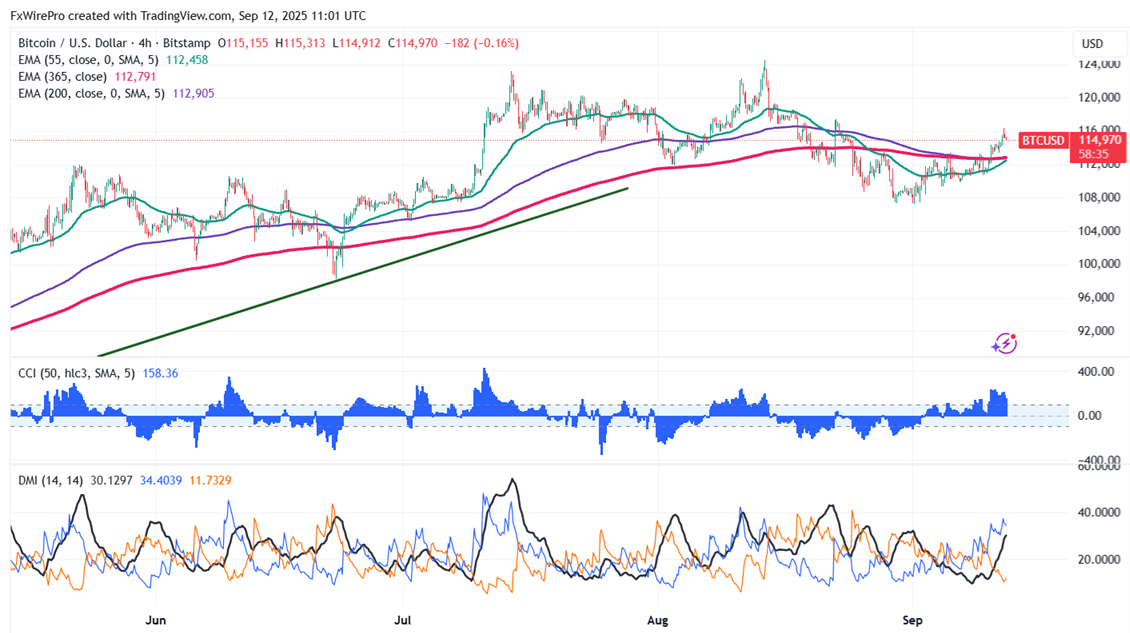
Technical Analysis: Key Levels to Watch for BTC/USD
BTC/USD gained slightly on strong institutional demand. The pair hits an intraday high of $116358 and is currently trading around $115016.
It trades above short-term (34-EMA and 55-EMA) and above long-term (200 and 365-EMA) moving averages on the 4-hour chart. Minor support is around $110000; breaking below this would drag the pair down to $10720/$103000/$10000. Immediate resistance is around $118000 indicates that closing above this level could lead to targets $120000/$125000/ $130,000, or even $135,000.
Investment Strategy: Opportunities for Traders
Indicators (4-hour chart).
CCI(50)- Bullish
Directional movement index - Bullish
It is good to buy on dips around $112000 with a stop-loss set at $107000 for a TP of $125000/$135000.


