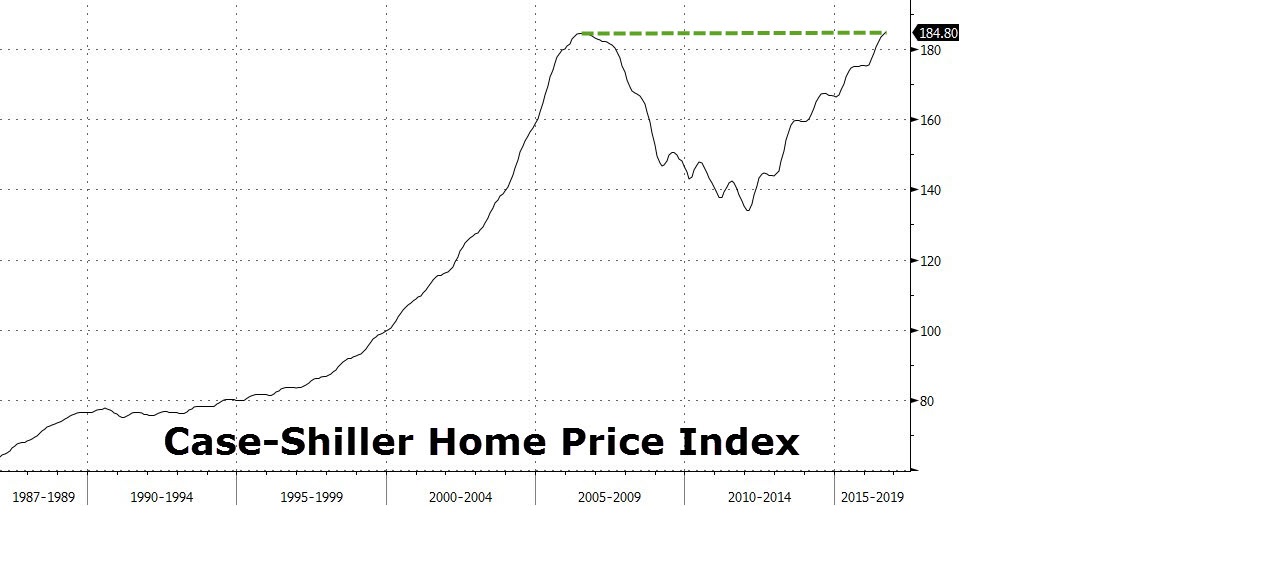
This chart shared by zerohedge.com shows the crisis ceiling is finally cleared as the home prices soared above the peak made on July 2016.
The average home price for September was 0.1 percent above the July 2006 peak in nominal terms. The National index reported a 5.5 percent annual gain in September, up from 5.1 percent in the previous month. The 10-City Composite posted a 4.3 percent annual increase, up from 4.2 percent in the previous month. The 20-City Composite reported a year-over-year gain of 5.1%, unchanged from August.