


 Sell the Bounce": Gold Rally Stalls Near $4165 as Fed Hawks Slam the Door on Rate Cuts — Targets $4000/$3600
  Trump’s Iran Strategy: What Has Been Achieved After Three Months of Conflict?
  Gold's 365-Day EMA Streak Since Oct 2023 Faces Its First Real Test at $3,980 — Break or Bounce to $4,140?
  China’s AI Manufacturing Boom Masks Weak Consumer Economy, Citi Says
  World Cup technology: from ref cams to AI analysts, cutting-edge research is changing the game
  J.P. Morgan Sees Potential Vestas Guidance Upgrade Amid Strong Wind Energy Demand


 - EconoTimes)


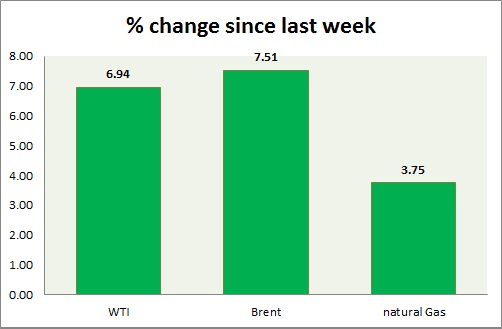
Energy as an asset class is the worst performer in today's trading and this week's. Weekly performance at a glance in chart & table -
- Oil (WTI) - WTI selloffs accelerated as expected after key support level got broken. WTI is yet to reach initial target of $42/ barrel. WTI is currently trading at $45.20/ barrel, down nearly 4% today. Immediate support lies at 42 and resistance at 48.3.
- Oil (Brent) - Brent fell in today's trading but gained over the spreads. Brent-WTI spread is trading at $ 10.7, support lies at $8 and resistance at $13. Price pattern suggests a move towards $ 53/barrel is likely as key support at 58 was broken. Brent is trading at $56.09/barrel. Immediate support lies at 53.2 & resistance at 58.4.
- Natural Gas - Natural gas prices fell as inventory shrinkage was lower than previous, however inventory fell below 5 year average. Natural Gas is currently trading at 2.69/mmbtu. Price range is squeezing, there might be breakout ahead. Immediate support lies at 2.65 & resistance at 2.87.
|
WTI |
-8.67% |
|
Brent |
-5.95% |
|
Natural Gas |
-5.28% |


